
Figure 3. The impact of DNM1L variants on mitochondrial network length and DRP1 mitochondrial co-localisation.
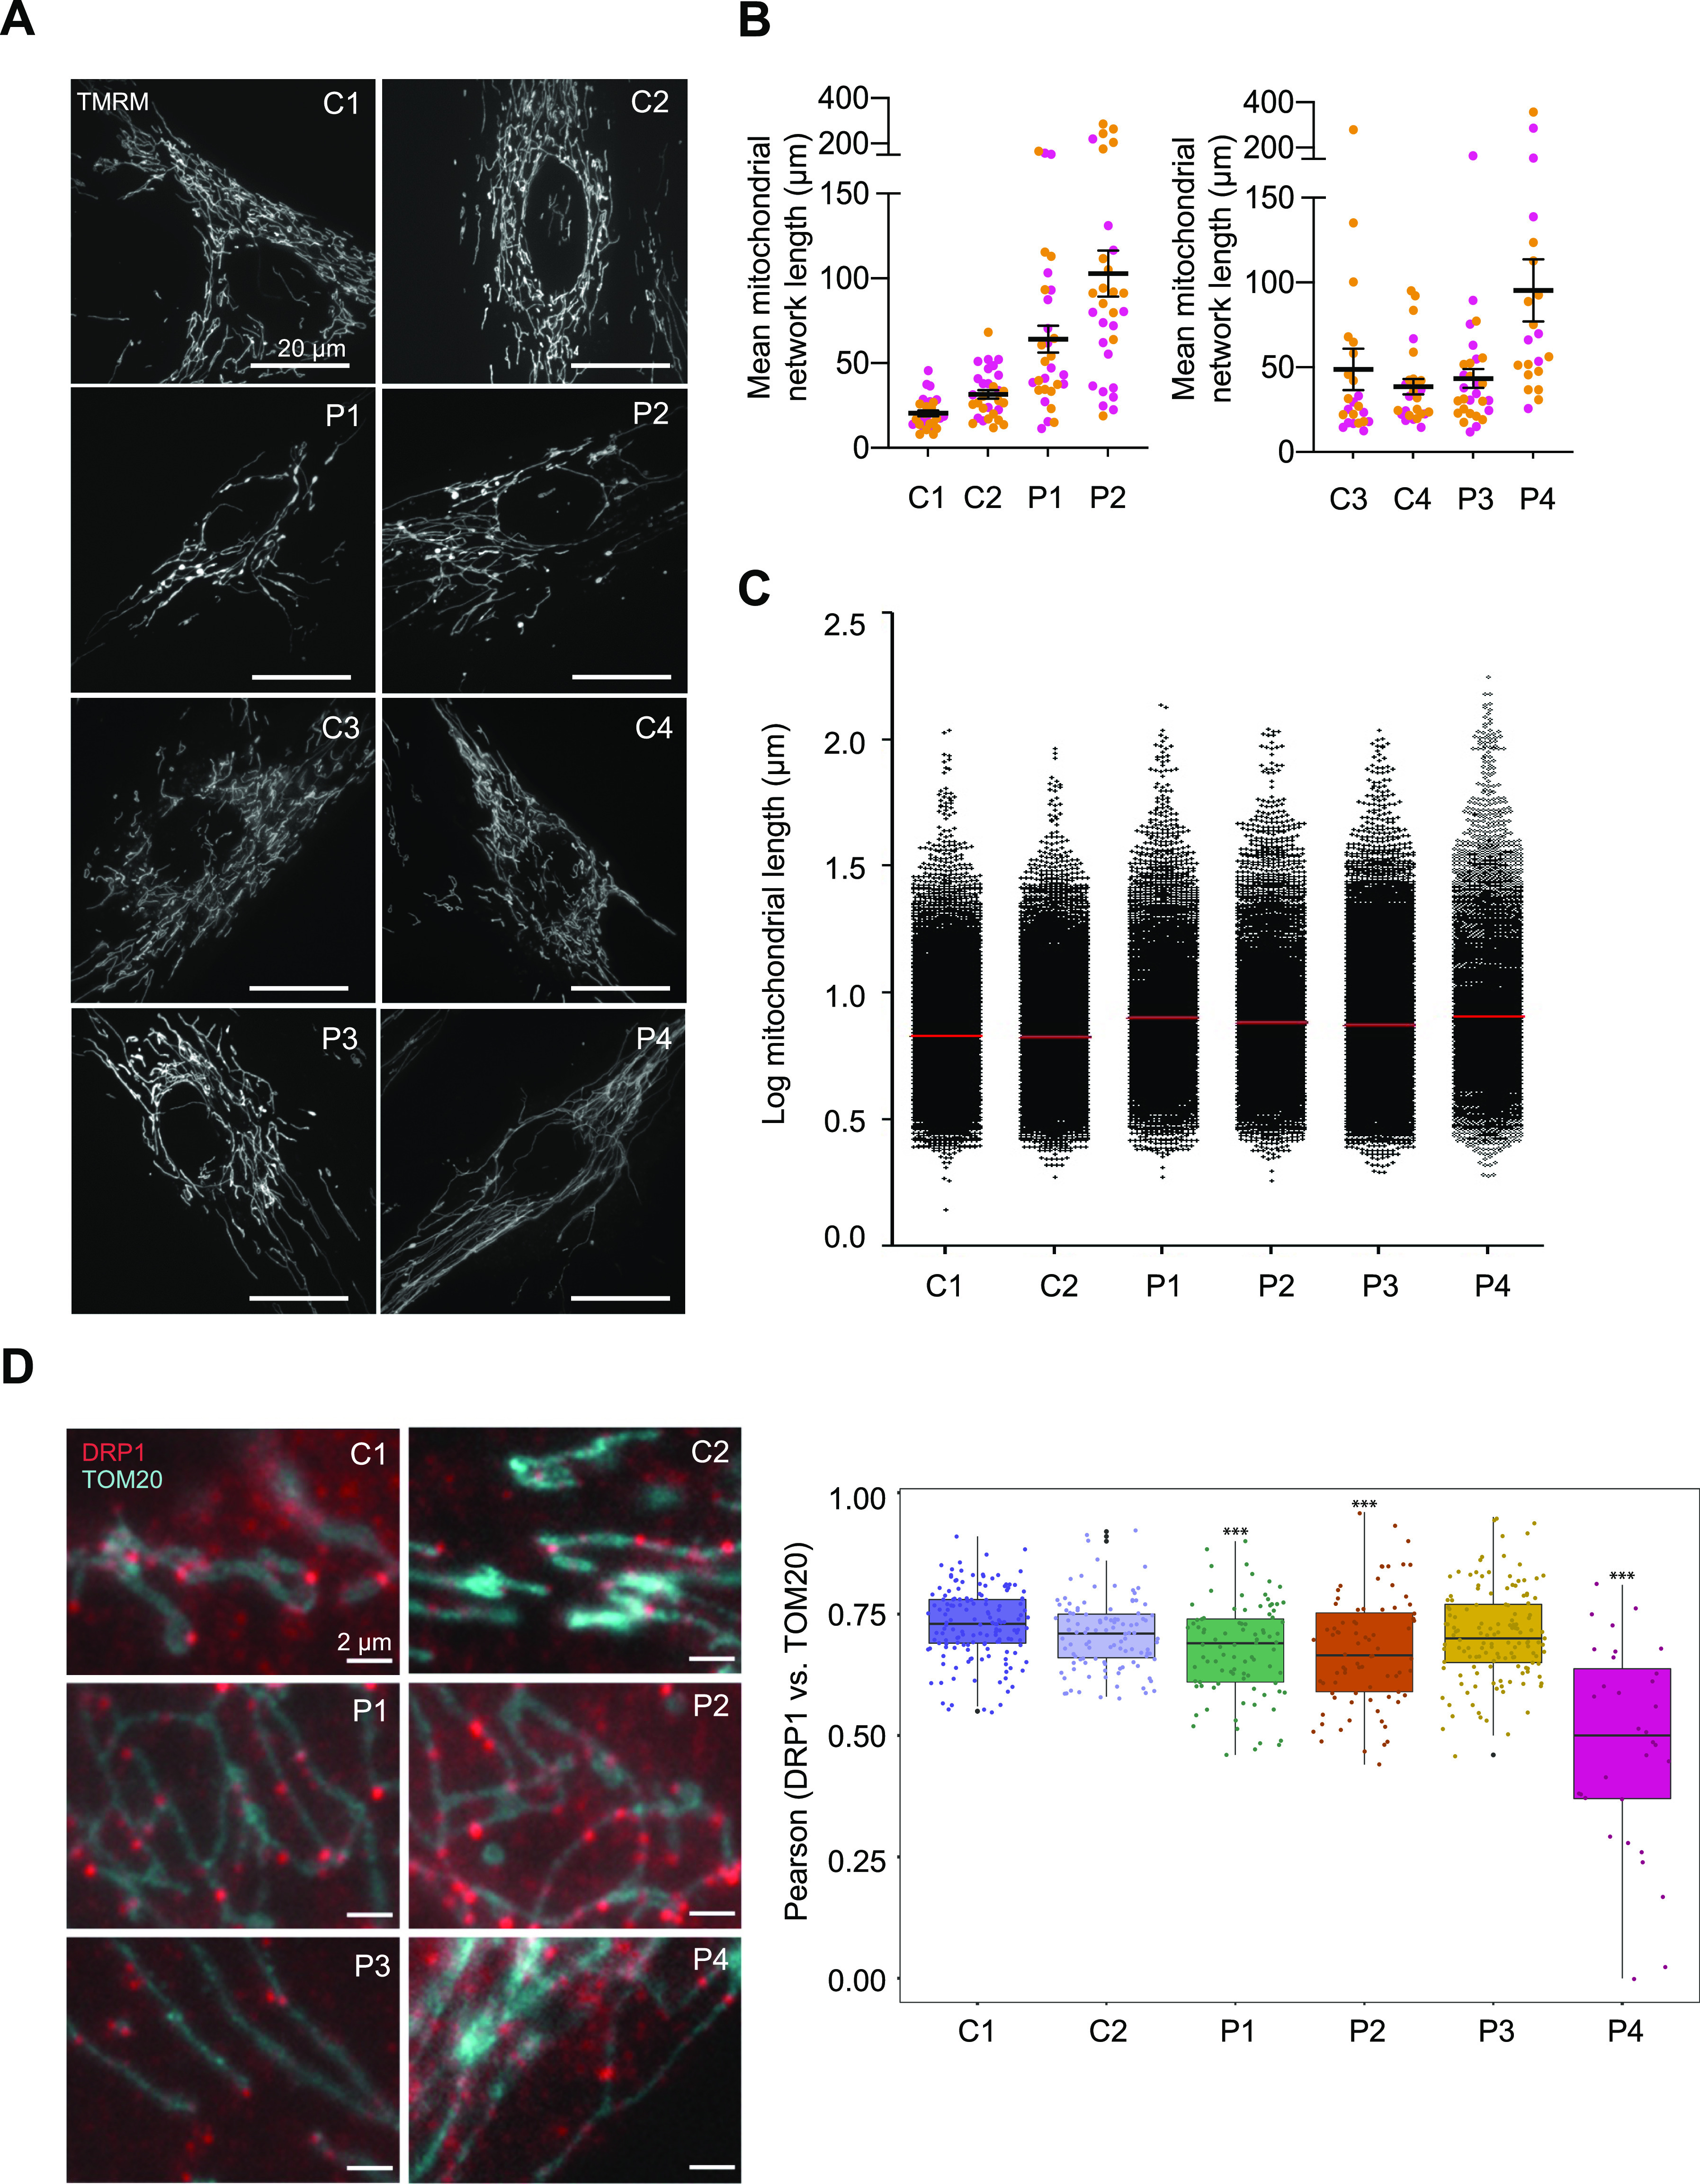
(A) Representative images of TMRM-stained mitochondrial network in paediatric (C1 and C2) and adult (C3 and C4) controls and DNM1L patient (P1–P4) fibroblasts. (B) Quantification of mean mitochondrial network length via MiNa using ImageJ n > 20 fields from two independent experiments, calculated by multiplying mean branch length and mean number of branches per network. Non-parametric one-way ANOVA and Dunn’s multiple comparisons using GraphPad Prism were used to calculate statistically significant differences between groups. (C) Mitochondrial network length using immunofluorescence analysis of fixed paediatric control (C1), adult control (C2), and DNM1L patient (P1–P4) fibroblasts labelled with TOM20 antibodies. The Columbus (PerkinElmer) software was used to quantify the hyperfusion of patient mitochondrial networks relative to controls and a minimum of 5,500 mitochondria were analysed for each case. The immunofluorescence labelling was performed three times. (D) Analysis of DRP1 co-localisation with the outer mitochondrial membrane protein TOM20 by immunofluorescence labelling of age-matched controls (C1: paediatric, C2: adult) and DNM1L patient (P1–P4) fibroblasts with anti-DRP1 (red puncta) and anti-TOM20 (in blue). DRP1 co-localisation with mitochondria was analysed in at least 32 cells per subject in two independent experimental sets. Pearson’s correlations between DRP1 puncta and TOM20 in each cell line are shown as box plots. One-way ANOVA with post hoc Tukey’s honest significant difference test was used to determine statistically significant differences (***P ≤ 0.001). Representative merged immunofluorescence images of fibroblasts stained with anti-TOM20 and anti-DRP1 antibodies are shown on the left.