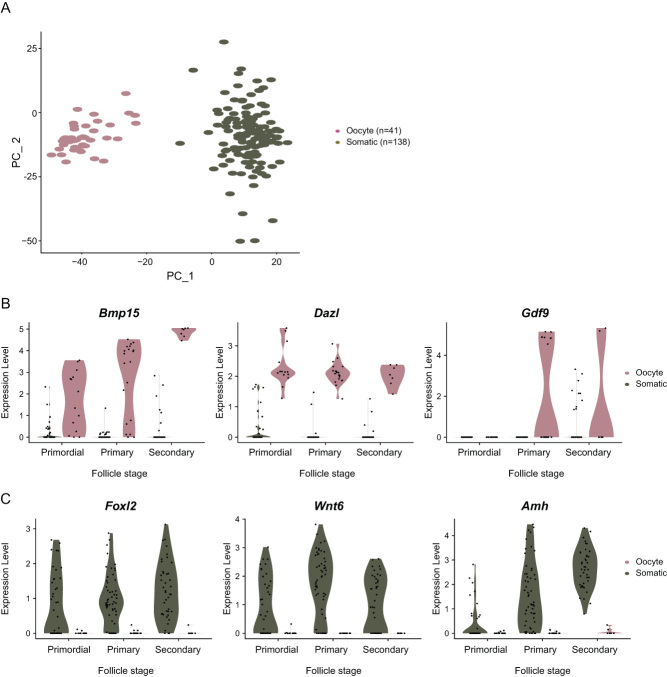
Figure 5.
Gene expression dynamics and marker gene expression in the isolated single cells. Oocytes (14 primordial, 20 primary, and 7 secondary follicle stages) and somatic cells (40 primordial, 56 primary, and 42 secondary follicle stages) collected and filtered computationally were analyzed and visualized on a PCA plot after scRNA-seq. The cells were clustered and colored by cell type (A). Known oocyte (B) and somatic maker gene expression (C) of the three follicle stages were shown in the violin plots.

 This work is licensed under a