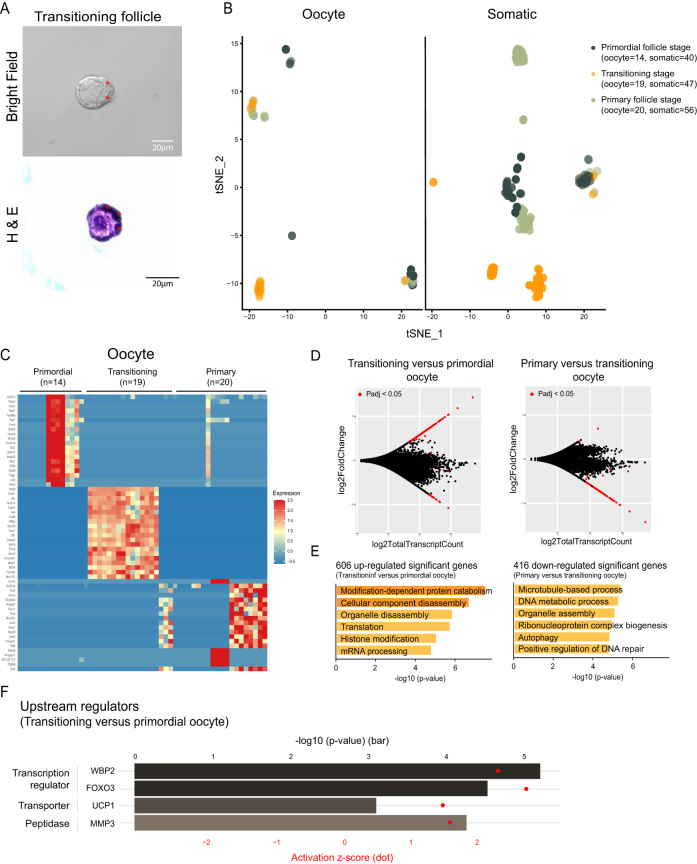
Figure 6.
Gene expression dynamics in oocytes and somatic cells during follicle activation. Transitioning follicles were identified by partial squamous and partial differentiated somatic cells (wedge-shaped or cuboidal as marked in red asterisks) surrounding their central oocytes (A). The follicles were first imaged with a bright-field microscope (A, upper panel), then encapsulated and sectioned for H&E staining to verify the stages (A, lower panel). Single oocytes (14 primordial, 19 transitioning, and 20 primary follicle stages) and somatic cells (40 primordial, 47 transitioning, and 56 primary follicle stages) were analyzed and visualized on a t-SNE plot after scRNA-seq (B). The expression of top 20 genes with highest fold change value among primordial, transitioning, and primary follicle oocytes were selected and visualized on a heatmap (C). MA plots of transitioning vs primordial follicle oocytes (D, left) or primary vs transitioning oocytes (D, right) were shown with the log2 value of total transcript count on the x-axis, and the log2 value of fold change on the y-axis. Genes with significant adjusted P-value (Padj <0.05) were marked in red (D). Gene annotation analyses were performed using the upregulated DEGs identified in between transitioning oocytes vs primordial follicle oocytes (E, left), or downregulated DEGs identified in primary follicle oocytes vs transitioning oocytes (E, right). Upstream regulator analysis was performed on the DEGs identified in between transitioning oocytes vs primordial follicle oocytes. P-value was presented in bar plot according to the upper x-axis. Activation z-score was presented in dot plot according to the lower x-axis (F). Scale bar= 20 μm.

 This work is licensed under a