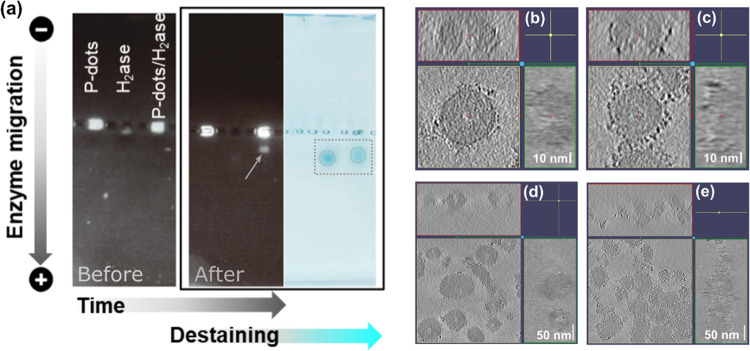
Figure 2.
(a) Agarose gel electrophoresis of Pdots, hydrogenase, and Pdots with hydrogenase before and after applied potential (black and white images) and after destaining (light blue image). Note that an excess of Pdots relative to H2ase was employed in these experiments. Orthogonal cross sections of cryo-electron tomograms of P1/P2 Pdots before (b, d) and after incubation with hydrogenase (c, e).

