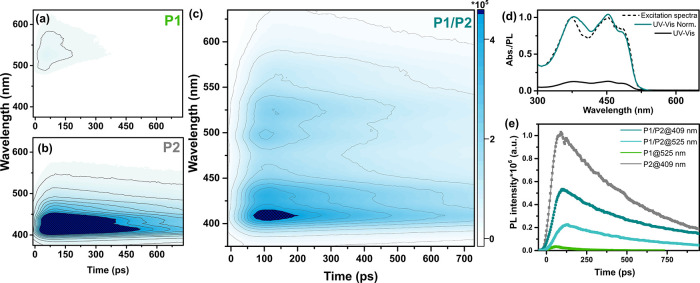
Figure 4.
Time-resolved fluorescence spectral decay profiles of P1 Pdots (a), P2 Pdots (b), and binary P1/P2 Pdots (c) measured with a streak camera upon excitation at 370 nm. The scale bar on the left of (c) represents intensity in the corresponding 2D graphs (a–c). (d) Steady-state UV–vis (black) and normalized steady-state UV–vis (cyan) of binary P1/P2 Pdots. The fluorescence excitation spectrum recorded with emission at 680 nm (black dotted). (e) Kinetic traces extracted at 525 nm for P1 Pdots (green) and P1/P2 Pdots (light cyan) and at 409 nm for P2 Pdots (gray) and P1/P2 Pdots (dark cyan).

