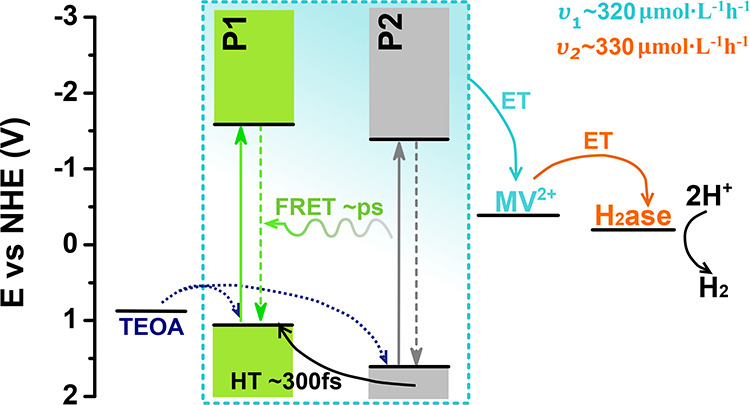
Figure 7.

Energy diagram summarizing the photophysical processes involved with biohybrid assembly during photocatalysis. The cyan highlighted portion represents processes of photogeneration and charge separation within heterojunction Pdots (ET—electron transfer, HT—hole transfer). Curved arrows represent charge transfer processes. Rates for MV•+ formation (υ1) and reduced hydrogenase formation (υ2) are reported for the system with 30 vol % TEOA.
