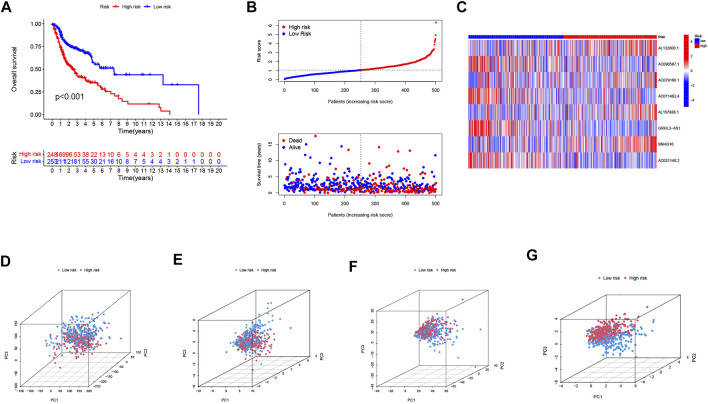
FIGURE 3.
Validation of the risk model in the entire cohort and principal component analysis. (A) Kaplan–Meier curves for survival analysis in the entire cohort. (B) risk score distribution and survival status in the entire cohort. (C) heatmap of the prognostic markers and overall survival in the entire cohort. PCA between the high- and low-risk groups based on the (D) all genes, (E) cuproptosis-related genes, (F) cuproptosis-related long noncoding RNA (lncRNAs), and (G) cuproptosis-related lncRNAs prognostic marker.

