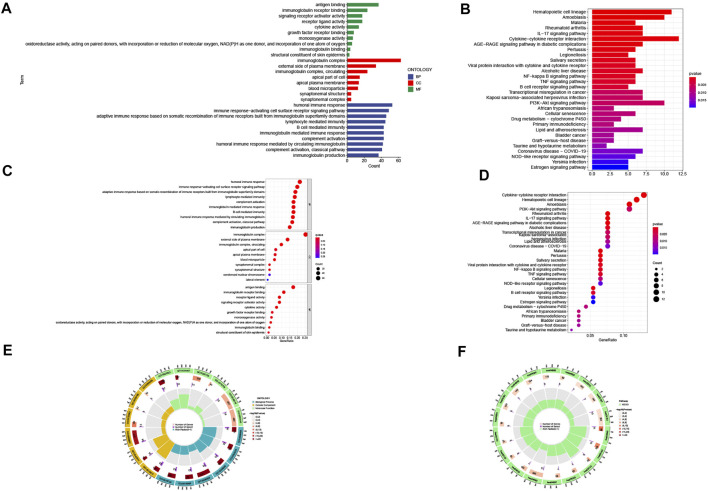
FIGURE 6.
Gene Ontology (GO) and Kyoto Encyclopedia of Genes and Genomes (KEGG) pathway enrichment analysis. (A) barplot of the top 10 GO enrichment terms. (B) barplot of the top 30 KEGG enrichment terms. (C) bubble chart of the top 10 GO enrichment terms. (D) bubble chart of the top 30 KEGG enrichment terms. (E) circle diagram of GO enrichment analysis. (F) circle diagram of KEGG enrichment analysis. Biological process, cellular component, and molecular function.

