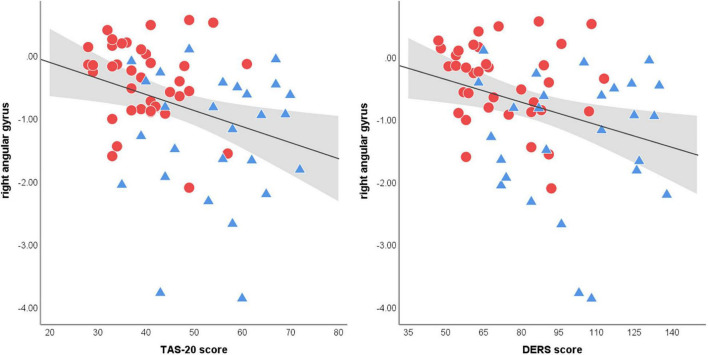
FIGURE 3.
Scatter plots of the correlation between right angular gyrus activation during affective ToM processing and clinical measures. Both Toronto Alexithymia Scale (TAS-20) and Difficulties in Emotion Regulation Scale (55) scores shows significant correlations with angular gyrus activations (spearman’s r = −0.37. p = 0.002; spearman’s r = −0.37. p = 0.003, respectively). The linear trend-line is demonstrated in black and the area colored in gray represents 95% confidence intervals of mean scores (red circle = NSSI group, blue triangle = control group).

