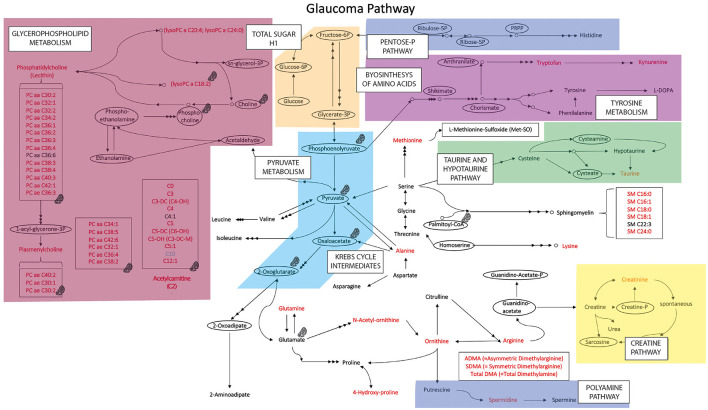
Figure 5.
Metabolic pathway map summarizing the results obtained in glaucoma samples. In red the metabolites whose concentration is increased in the glaucoma samples (compared with values in samples from healthy controls), in light blue the metabolite whose concentration is reduced in glaucoma samples. Compounds within ellipses were not determined in this study; they are included as nodes in metabolism interconnections. Areas in color represent main metabolic pathways.  Icon indicates compound/group of compounds that may be in mitochondria or are directly/indirectly related to mitochondria.

