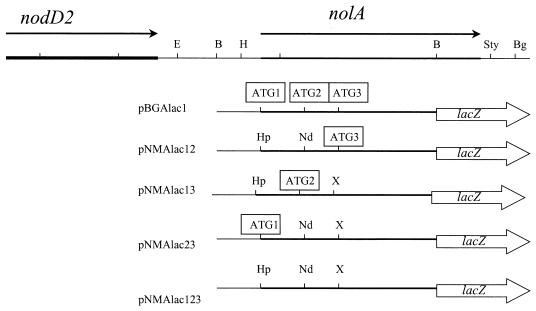
FIG. 3.
Restriction map of the B. japonicum chromosome showing the location of nolA and nodD2. Only the pertinent restriction sites are shown: H, HindIII; B, BamHI; N, NheI; S, SalI; Sty, StyI; Bg, BglII; E, EagI. Below the restriction map are shown the various nolA derivatives generated by site-directed mutagenesis of the ATG start sites. These mutant derivatives are represented in the figure as nolA-lacZ fusions used in the study. The open arrowhead rectangles represent the pNM480 vector and in-frame C-terminal fusion. The open squares indicate the start sites from which translation of nolA can occur. The restriction sites generated during the mutagenesis are shown: Hp, HpaI; Nd, NdeI; X, XhoI.

