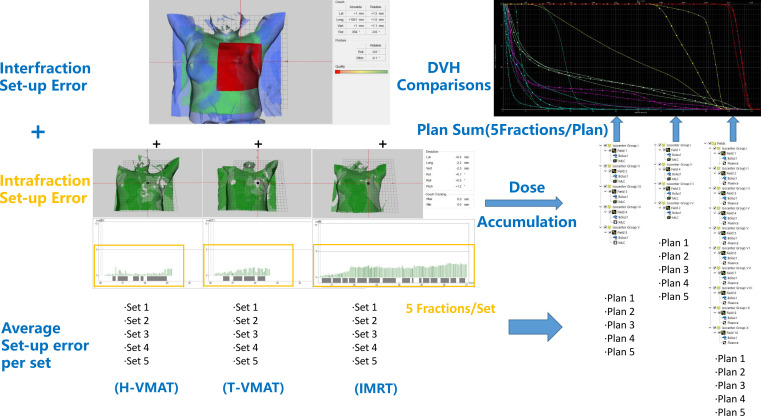
Figure 3.
The workflow used to generate the SGRT-based setup errors and dose accumulation is shown. First, non-rigid algorithm was used for interfraction setup error analysis. Then we subdivided the intrafraction setup error of each field and each technique divided 25 fractions into 5 sets (5 fractions per set). Furthermore, sum up the average setup error for each set. Finally, the setup errors imported to TPS and converted each field into an isocenter group, then accumulated and compared dose. In the DVH comparisons figure, —shown as T-VMAT, —shown as H-VMAT, —shown as IMRT.

