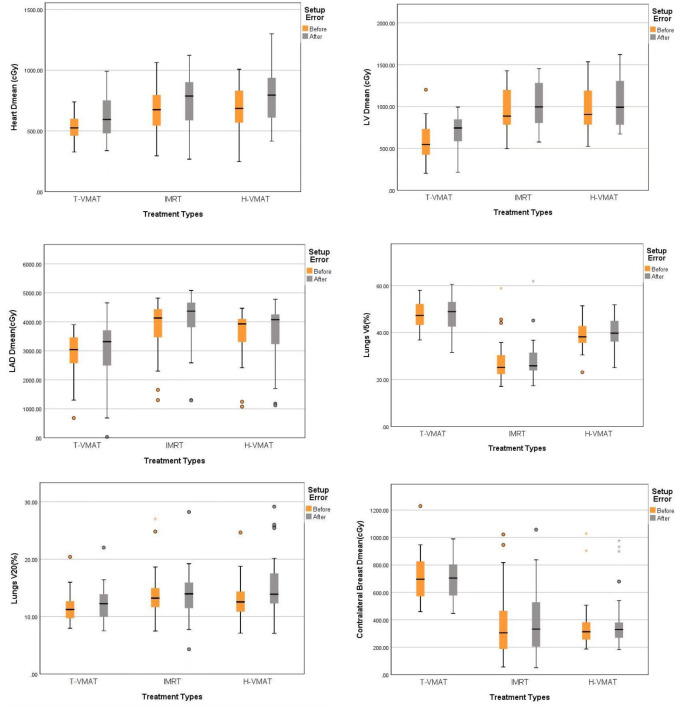
Figure 5.
Box-whisker plot of dosimetry parameters with error bars:Heart Dmean, Left ventricle Dmean, Left anterior Dmean, Lungs V5, Lungs V20, Contralateral breast Dmean. Each figures show the dose changes of each OARs before and after the recalculation of setup error. Gray bars represent the accumulated dose after the consideration of setup error, and yellow bars represent the dose not considered of setup error. The points in the graph represent outliers, the black horizontal lines in the figures represent the average of each parameter.

