Figure 6.
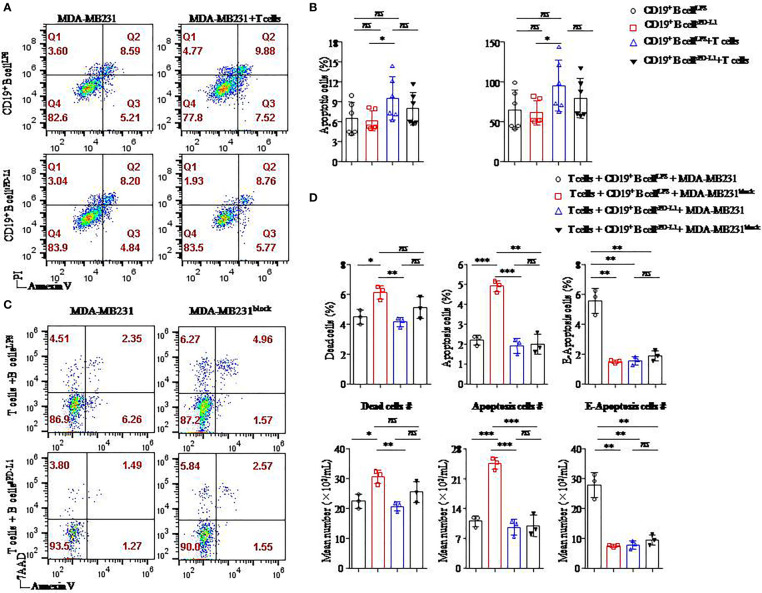
Breast cancer cell apoptosis was induced when the PD-L1 signal was blocked. Representative flow cytometry dot plot of apoptosis of PD-L1hi MDA-MB231 cells cultured with CD4+ T cells and CD19+ B cells pretreated with LPS or sPD-L1 (A). The percentage and absolute number of apoptotic cells were detected in PD-L1hi MDA-MB231 cells (n = 6) cultured with CD19+ B cells pretreated with LPS or sPD-L1 with or without CD4+ T cells (B). Representative flow cytometry dot plot of death, apoptosis, and E-apoptosis of PD-L1hi MDA-MB231 cells with or without PD-L1–blocking antibody treatment in the culture system including CD4+ T cells and B cells pretreated with LPS or sPD-L1 (C). The percentage and the absolute number of dead, apoptotic, and E-apoptotic cells were detected in PD-L1hi MDA-MB231 cells (n = 3) cultured with CD4+ T cells and CD19+ B cells pretreated with LPS or sPD-L1 with or without PD-L1–blocking antibody treatment (D). Data represent means ± SEM of at least three independent experiments and were analyzed by unpaired Student’s t-test. ns, not statistically significant. *P <0.05, **P <0.01, and ***P <0.001.

