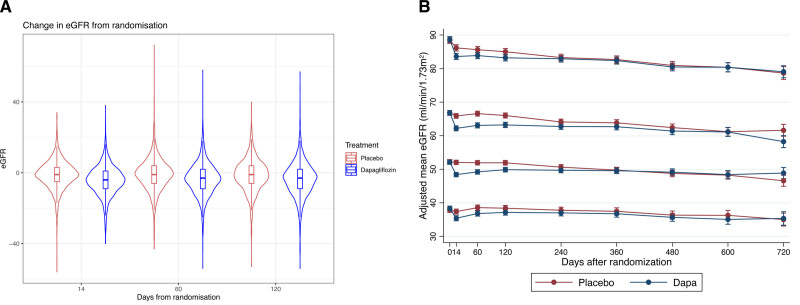
Figure 1.
Absolute change in eGFR from baseline to 14, 60, and 120 days in each treatment arm and change in eGFR with placebo and dapagliflozin according to baseline eGFR category (from top to bottom: ≥75, <75–≥60-, <60–≥45, <45 mL·min−1·1.73 m−2). A, Violin plot illustrating the change in estimated glomerular filtration rate (eGFR) from baseline. Rectangle in the middle of the violin shows the median and interquartile range. Lines show the smoothed probability density at different values; therefore, the width of the violin corresponds to the distribution of the data. B, Change in eGFR over time in each treatment arm and each baseline eGFR category from a repeated-measures mixed-effect model. Dapa indicates dapagliflozin.

