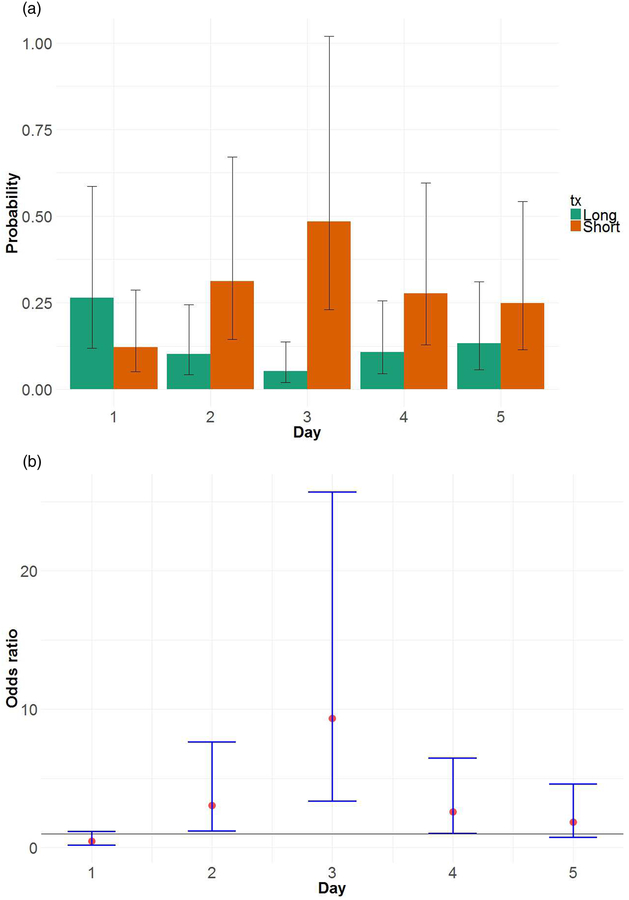
Figure 3:
(a) Probability of daytime asthma symptoms by treatment and day (bars), with 95% confidence intervals (error bars). Estimates were derived from longitudinal models discussed in the text. (b) Estimated odds ratios for Short versus Long, by day, with 95% confidence intervals. Results show that the biggest mean difference occurred on Day 3.

