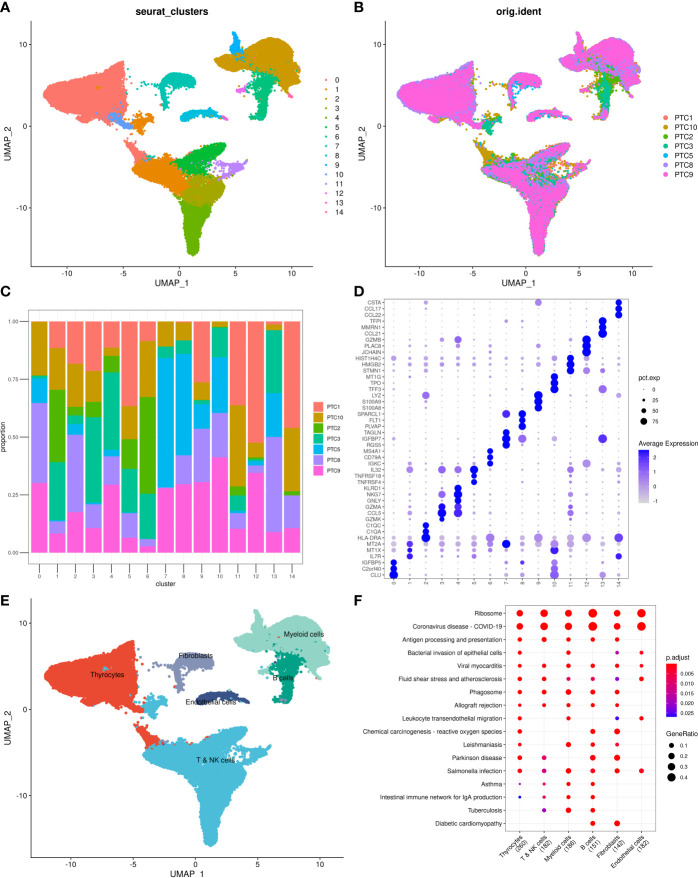
Figure 1.
Overview of identified single cells. (A) UMAP of cell profiles; different color blocks represent related cell clusters. (B) UMAP of cell profiles; different color blocks represent related sample sources. (C) Sample distribution of 15 cell clusters. (D) Heatmap showing marker genes for each cluster, highlighting selected marker genes for each cluster. (E) UMAP of cell profiles; different color blocks represent related cell types. (F) Function enrichment of markers for cell subsets. UMAP, Uniform Manifold Approximation and Projection.

