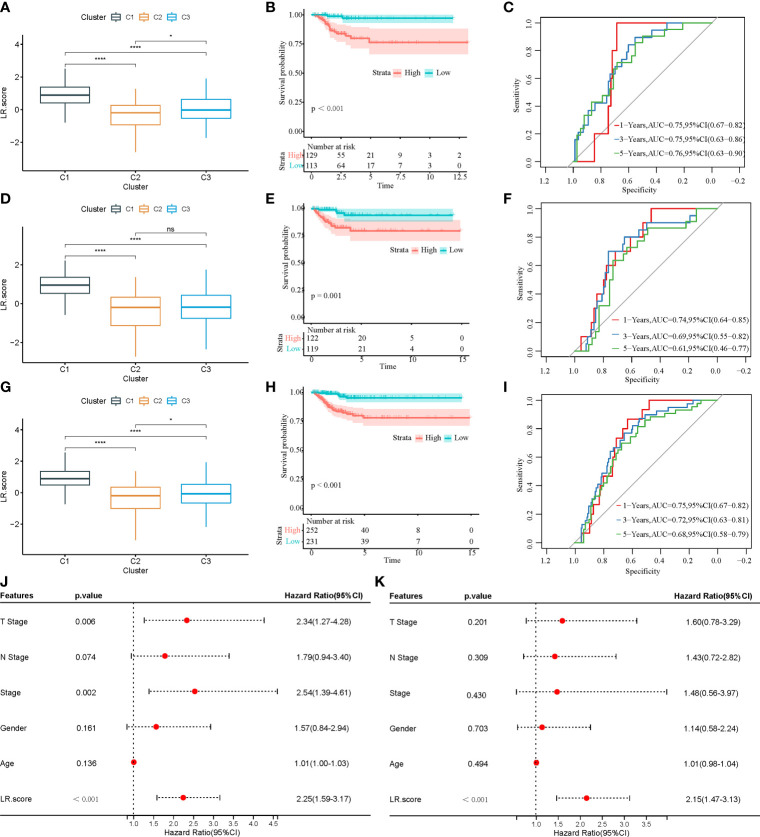
Figure 8.
(A) LR.score differences in different subtypes in the training set. (B) Survival analysis between high and low LR.score groups in the training set. (C) The predictive value of LR.score in 1-, 3-, and 5-year overall survival in the training set. (D) LR.score differences in different subtypes in the test set. (E) Survival analysis between high and low LR.score groups in the test set. (F) The predictive value of LR.score in 1-, 3-, and 5-year overall survival in the test set. (G) LR.score differences in different subtypes in the entire dataset. (H) Survival analysis between high and low LR.score groups in the entire dataset. (I) The predictive value of LR.score in 1-, 3-, and 5-year overall survival in the entire dataset. (J) Univariate Cox regression model analysis. (K) Multivariate Cox regression model analysis.

