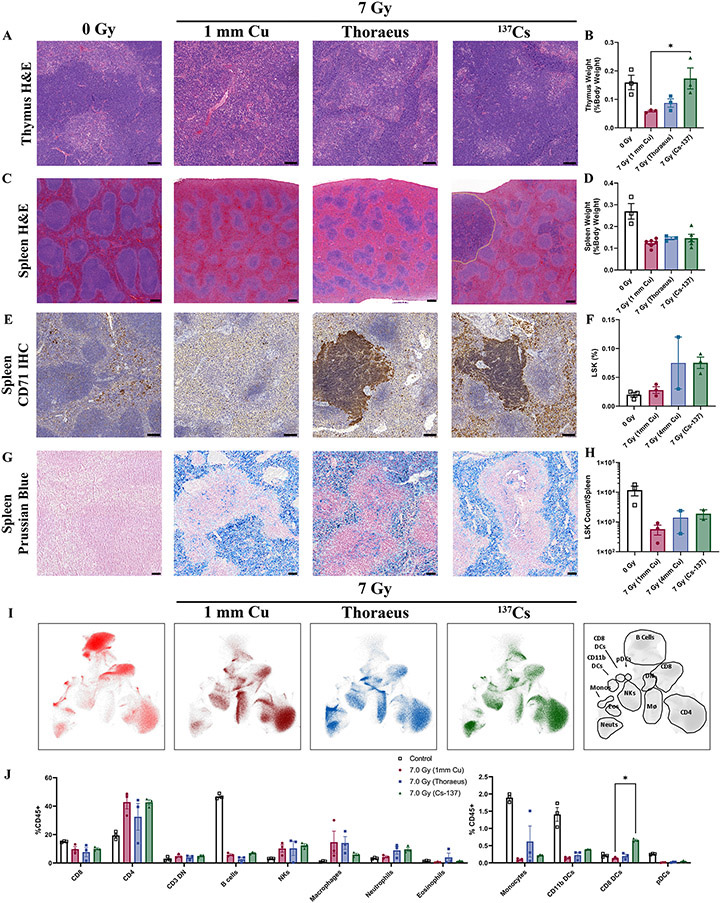
Figure 3: Splenic and Thymic Regeneration Following 7 Gy WBI Varies with Radiation Energy.
(A) Representative images of H&E-stained thymus 10-days post-IR from two independent experiments (Scale Bar 100 μm; n≥3/group). (B) Thymus weights 10-days post-irradiation represented as a percent of body weight at the time of euthanasia and analyzed by one-way ANOVA. (C) H&E-stained spleens harvested from mice 10-days post-irradiation with regions of extramedullary hematopoiesis delineated by dotted yellow lines. Results are representative of two independent experiments. (Scale Bar 200 μm; n≥6/group). (D) Spleen weights 10-days post-IR represented as a percent of body weight at the time of euthanasia and analyzed by one-way ANOVA. (n≥3/group). (E) CD71 IHC (brown) in spleens 10-days post-irradiation, representative of two independent experiments (Scale Bar 100 μm; n≥6/group). (F) Splenic flow cytometry for the percent of live Lin-, Sca-1+, c-Kit+ (LSK) cells 10-days post-irradiation analyzed by one-way ANOVA. (n≥2/group). (G) Spleens were stained with Prussian Blue to detect iron (blue) 10-days post-irradiation. Results are representative of three independent experiments. (H) Total number of LSK cells per spleen 10-days post-irradiation analyzed by one-way ANOVA. (I) Uniform manifold approximation and projection (UMAP) plots representing clusters of immune cell populations in the spleens 10-days post-irradiation. Gating strategy at right. (J) Leukocyte populations gated on UMAP clusters as a percent of total CD45+ cells were compared by two-way ANOVA. Data is represented as mean ± SEM. P<.05 (*), P<.01 (**), P<.001 (***), P<.0001 (****). DN: Double Negative, NKs: Natural-Killer Cells, DCs: Dendritic Cells, pDCs: Plasmacytoid Dendritic Cells.

