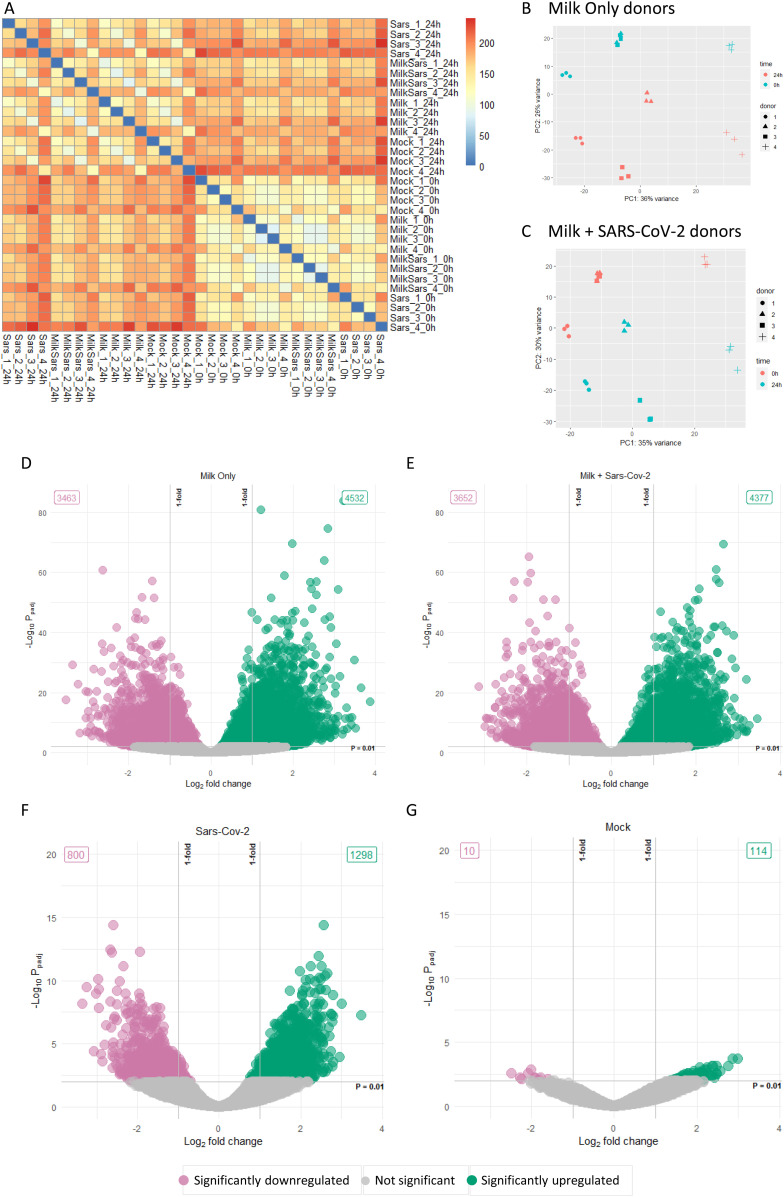
Figure 4. Overview of the transcriptome data.
(A) Heat map of sample-to-sample distances based on transformed count data. (B, C) Principal component analysis of the two milk-treated conditions. (D, E, F, G) Volcano plots of the log2fold change against the –log10 adjusted P-values of the different conditions. Significantly (adjusted P-value < 0.01) up-regulated and down-regulated hit shown in green and pink, respectively. Data information: In (D, E, F, G), each data point represents a gene. The log2fold change of each gene is represented in the x-axis and the log10 of its adjusted P-value is on the y-axis. Adjusted P-values are calculated using Benjamini–Hochberg procedure.

