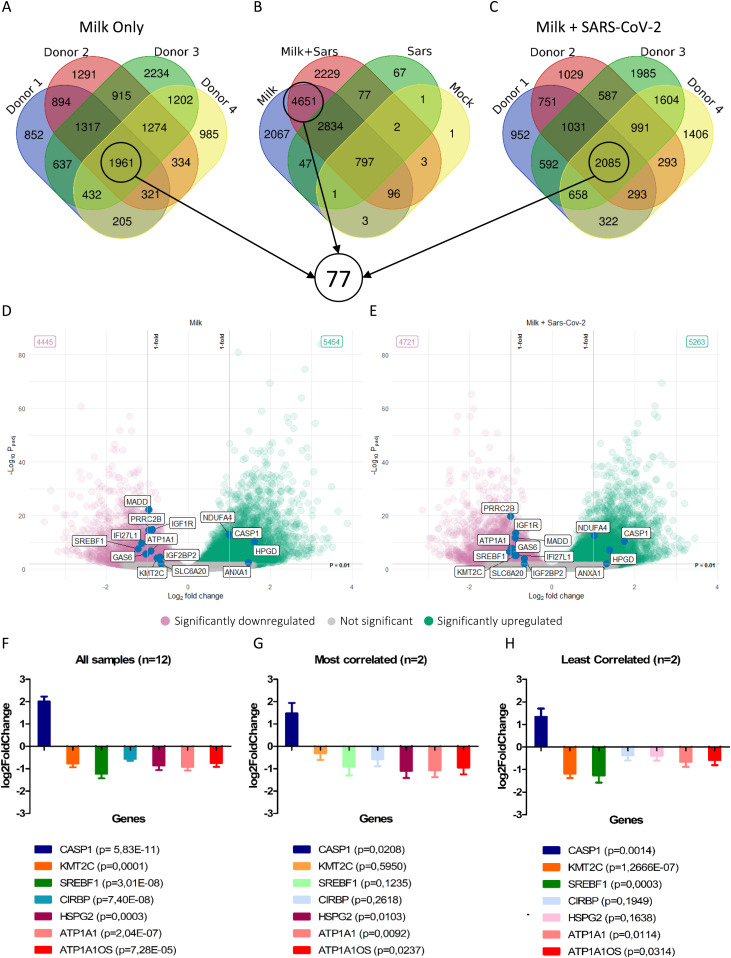
Figure 5. Transcriptome analysis of the milk-treated conditions.
(A, B, C) Venn diagram of overlapping genes across different conditions. Encircled are gene sets used for further analysis to identify common differentially expressed genes. (D, E) Volcano plots showing selected significant hits from the 77 genes listed in Table S2. (F, G, H) Log2fold change values of selected differentially expressed genes from Table S2 shown for datasets containing all samples (F, n = 12), most correlated samples (G, n = 2), and least correlated samples (H, n = 2). Genes that were not significantly (P > 0.05) expressed in the most correlated and least correlated datasets are faded out. Data information: In (D, E), each data point represents a gene. The log2fold change of each gene is represented in the x-axis and the log10 of its adjusted P-value is on the y-axis. Adjusted P-values are calculated using Benjamini–Hochberg procedure. In (F, G, H), data are presented as mean ± SEM. P-values calculated using Wald test.

