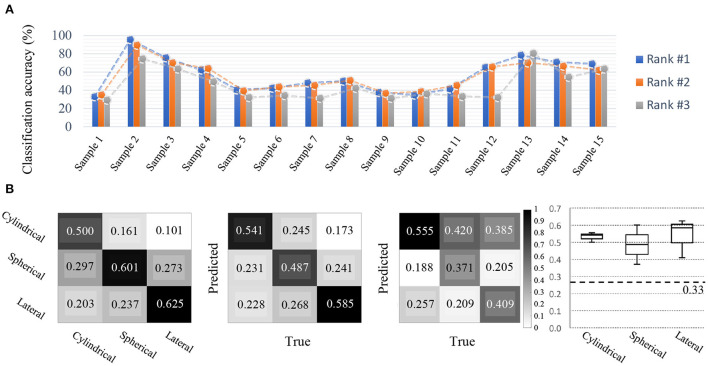
Figure 10.
Competition outcomes. (A) Cross-session BCI results (Accuracy). Compared to other disciplines, all participants achieved relatively good decoding performance. For cross-session BCI, various grasping MIs using a single-arm were performed, and the top-3 BCI model performances during various sessions were acceptable per each class. (B) Confusion metrices for each class and candle plot for comparison. Based on the results of the top-3 participants, the prediction by class and the true answer rate are organized into confusion metrics. From the left, metrices showing which class was predicted more accurately by Rank 1, Rank 2, and Rank 3 participants. The candle plot on the far right corresponds to classes Cylindrical, Spherical, and Lateral, respectively, from the left, and representing the mean and standard deviation of the classification results achieved by the top-3 participants by class.

