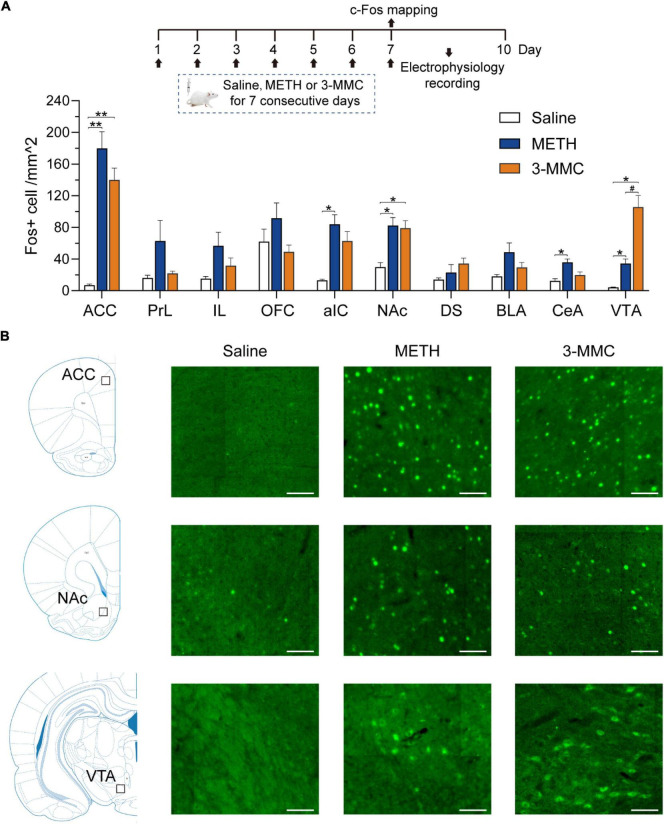
FIGURE 3.
Specific brain regions response to chronic 3-MMC exposure. (A) The c-Fos expression of rats 90 min after last injection of drugs, post hoc test, *P < 0.05, **P < 0.01 significant differences for 3-MMC vs saline or METH vs saline, #P < 0.05 significant differences for 3-MMC vs METH, n = 4 for each group. (B) Representative immunofluorescent images of c-Fos expression in ACC, NAc, and VTA. Scale bar, 100 μm. ACC, anterior cingulate cortex; PrL, prelimbic cortex; IL, infralimbic cortex; OFC, orbitofrontal cortex; aIC, anterior insular cortex; NAc, nucleus accumbens; DS, dorsal striatum; BLA, basolateral amygdala; CeA, central amygdala; VTA, ventral tegmental area. Data are presented as mean values ± SEM.

