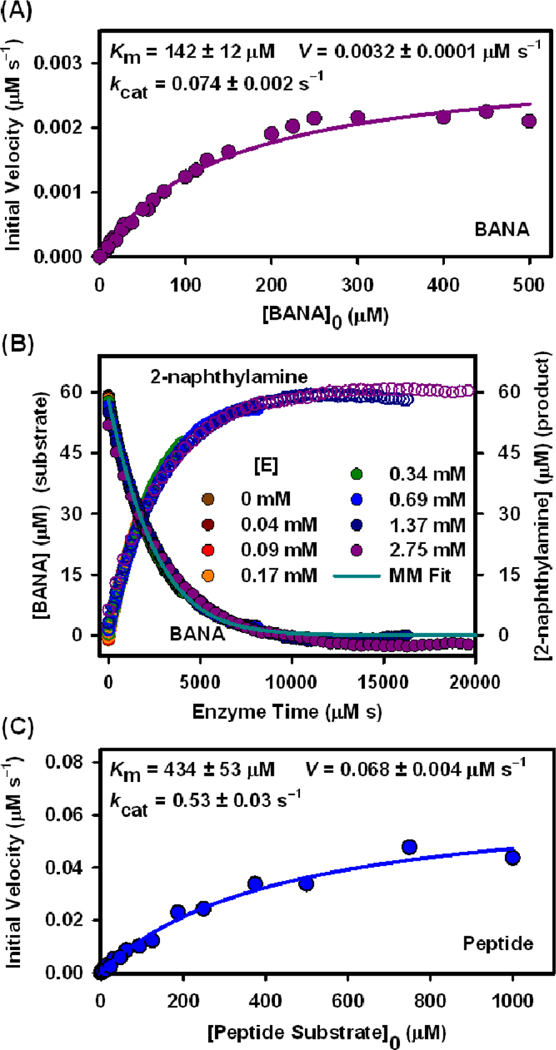
Figure 3.
(A) Michaelis-Menten (MM) plot for BANA hydrolysis. (B) Progress curves in enzyme-time for the hydrolysis of BANA (•) and formation of 2-naphthylamine product (○), catalyzed by different trypsin concentrations, . The solid line is the fit to the integrated MM model. (C) MM plot for peptide substrate digestion in solution.

