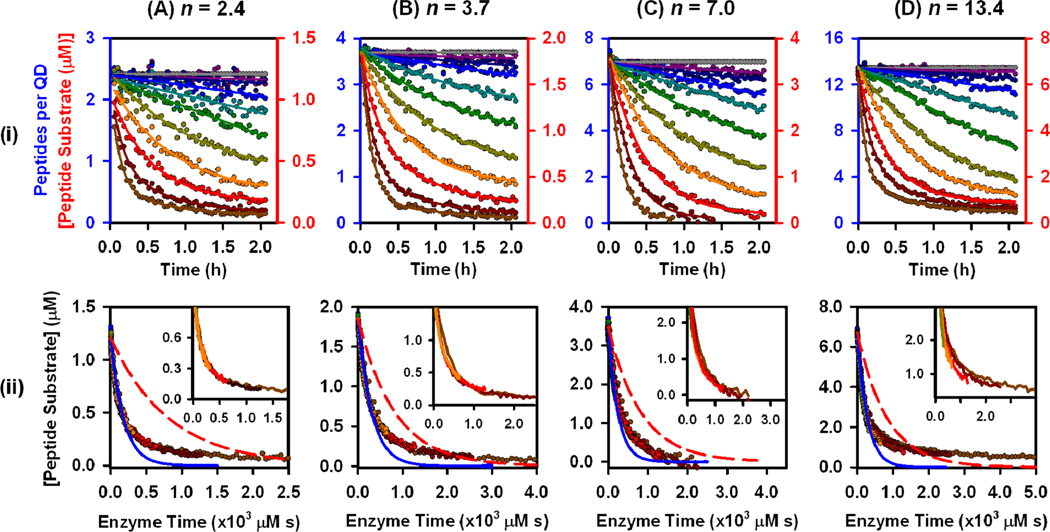
Figure 4.
Progress curves in (i) normal time and (ii) enzyme-time for hydrolysis of QD-(peptide-Cy3/A594)n conjugates, catalyzed by different trypsin concentrations: (A) n = 2.4 (Cy3), (B) n = 3.7 (Cy3), (C) n = 7.0 (Cy3), and (D) n = 13.4 (A594). Trypsin concentrations were 0, 1.3, 2.7, 5.4, 11, 22, 43, 86, 172, 343, 687 nM, except for n = 2.4, where 687 nM was replaced with 0.6 nM. In (ii), blue curves are best fits to the MM model, and red curves are those predicted from the values of and V for only the peptide substrate in bulk solution.

