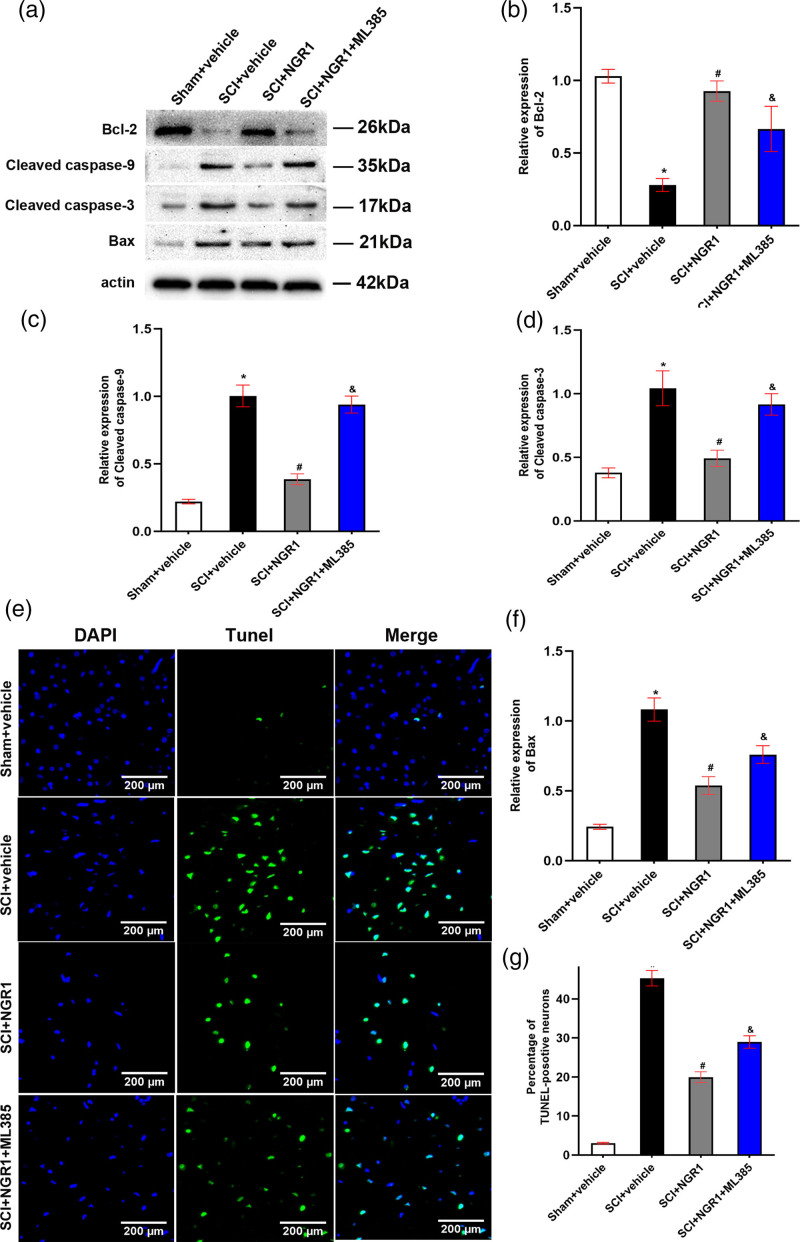
Fig. 5.
Involvement of the Nrf2/HO-1 signaling pathway in the NGR1-induced inhibition of apoptosis after SCI. (a) The representative image of Western Blot analysis for Bcl-2, c-Caspase-9, c-Caspase-3, and Bax in the Sham + vehicle, SCI + vehicle, SCI + NGR1, and SCI + NGR1 + ML385 groups at 14 days after SCI. (b–e) Quantitative analysis of Bcl-2/actin, Cleaved caspase-9/actin, Cleaved caspase-3/actin and Bax/actin in each group. N = 3. Data are represented as mean ± SEM. *P < 0.05 vs. the Sham + vehicle group; #P < 0.05 vs. the SCI + vehicle group; &P < 0.05 vs. the SCI + NGR1 group. (f) The representative image of Tunel staining in the Sham + vehicle, SCI + vehicle, SCI + NGR1, and SCI + NGR1 + ML385 groups at 14 days after SCI. Bars = 200 μm (200×). (g) Quantitative analysis of the percentage of TUNEL-positive neurons in each group. N = 3. Data are represented as mean ± SEM. One-way analysis of ANOVA with Turkey’s post hoc tests was used. *P < 0.05 vs. the Sham + vehicle group; #P < 0.05 vs. the SCI + NGR1 group; &P < 0.05 vs. the SCI + NGR1 group. ANOVA, analysis of variance; HO-1, heme oxygenase-1; NGR1, notoginsenoside R1; Nrf2, nuclear factor erythroid 2 related factor 2; SCI, spinal cord injury.

