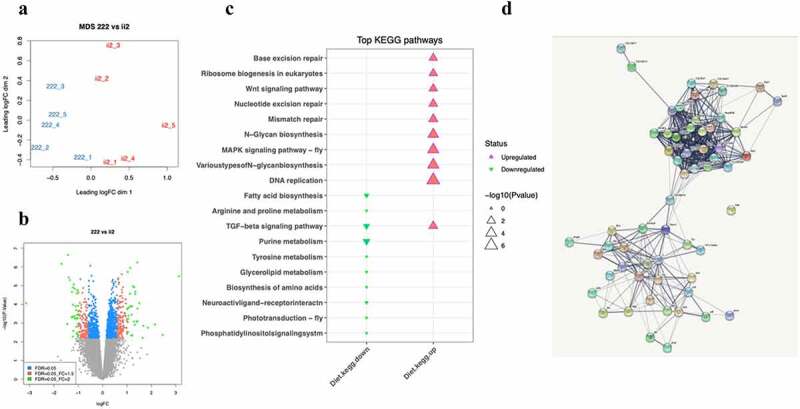
Figure 4.

RNAseq analysis: (a) Multidimensional scaling (MDS) plot showing separation between samples (222 = 3 generations fed on 1:2 Protein: Carbohydrate diet, ii2 = change in ancestral diet). (b) Volcano plot showing gene expression changes associated with the 222 diet. (c) Top KEGG pathways as found using kegga (limma). (d) Genes involved in the Ribosome and MAPK signalling pathways had a fold change between the 222 diet and the ii2 diet with an FDR < 0.1. Edges indicate an interaction between genes.
