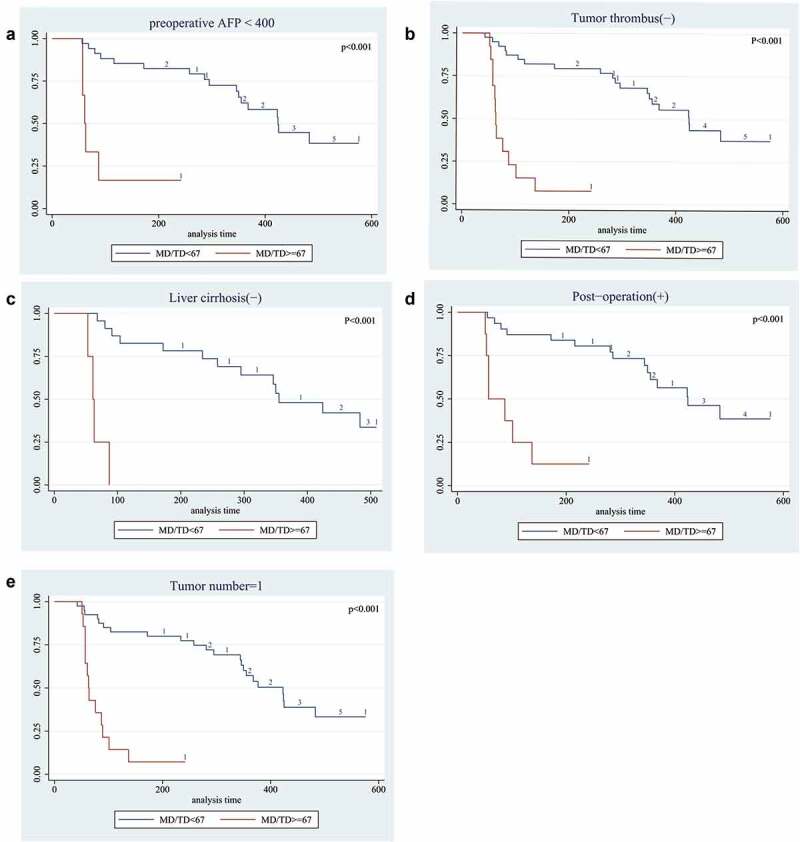
Figure 2.

Long-term survival outcomes in HCC with mutation frequency using Kaplan-Meier’s analysis:A. Survival curve of mutation frequency in patients with AFP<400. The results shown that the patients with MD/TD≥67 had worse survival time; B. Survival curve of mutation frequency in patients with Tumor thrombus. The results shown that the patients with MD/TD≥67 had worse median survival time; C. Survival curve of mutation frequency in patients without liver cirrhosis. The results shown that patients with MD/TD≥67 had worse median survival time; D. Survival curve of mutation frequency in patients who treated by Post-operation TACE. The results shown that patients with high MD/TD had worse survival time; E. Survival curve of mutation frequency in patients with Single lesion. The results shown that MD/TD≥67 result had worse median survival time. P value was assessed using the log-rank test.
