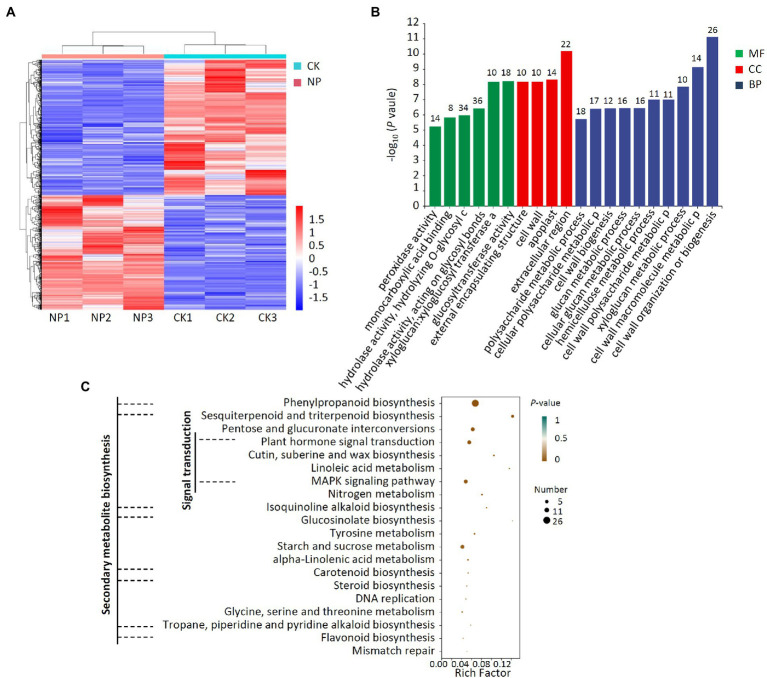
Figure 8.
Transcriptome analysis of DEGs in pear twigs treated with P. polymyxa strain Nl4. (A) Heat map analysis. CK, untreated pear twigs; NP, strain Nl4 treated pear twigs. Red indicates highly expressed genes, and blue indicates low expressed genes. (B) GO annotation analyses of DEGs. The number above the column represents the number of DEGs. (C) KEGG pathway enrichment analyses of the DEGs. Rich factor = DEGs number/total gene number identified from transcriptome of a certain process.

