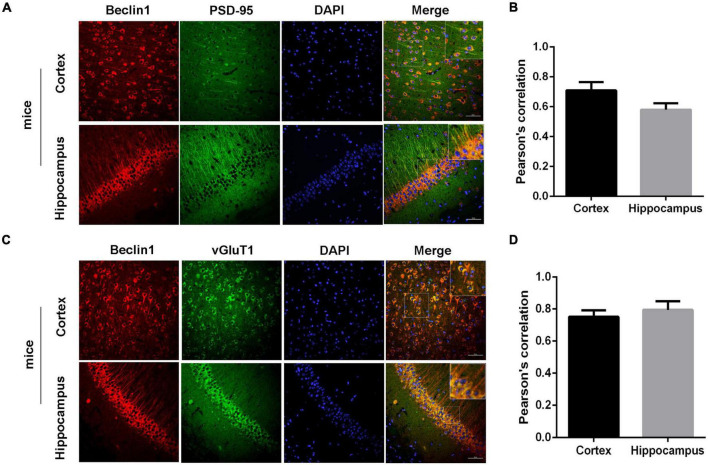
FIGURE 5.
Beclin1 was colocalized with an excitatory synaptic protein. (A) Representative image showing the distributions of Beclin1 and the excitatory postsynaptic protein PSD-95 in mouse brain sections. (B) The extent of the colocalization was quantified using Image-Pro Plus software. (C) Representative image showing the distributions of Beclin1 and the excitatory presynaptic protein vGluT1 in mouse brain sections. (D) The extent of colocalization was quantified [wild-type (WT) group: n = 11, beclin1± group: n = 9]. Data are presented as the means ± SEM. Scale bars: 50 μm. Student’s t-tests were performed.

