Figure 3.
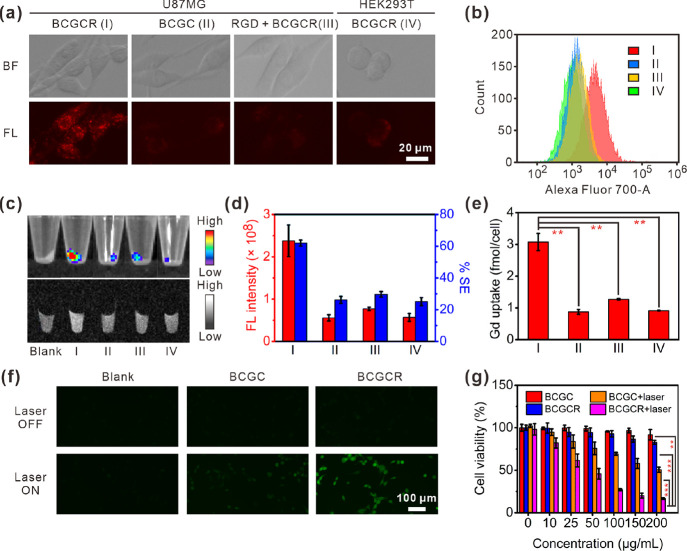
In vitro bimodal imaging of cells, CDT performance, and cytotoxicity studies. (a) Fluorescence images of (I) U87MG cells incubated with BCGCR (100 μg/mL, 2 h), (II) U87MG cells incubated with BCGC (100 μg/mL, 2 h), (III) U87MG cells incubated with RGD (10 μM, 1 h) followed by BCGCR (100 μg/mL, 2 h), or (IV) HEK293T cells incubated with BCGCR (100 μg/mL, 2 h) (ex: 650 ± 22 nm, em: 720 ± 30 nm). (b) Flow cytometry assays of fluorescence intensity in cells after similar treatments with BCGC or BCGCR (10 μg/mL) for 2 h (ex: 633 nm, em: 710 ± 25 nm). (c) Fluorescence (top) (ex/em. = 675/720 nm) images of cell pellets after similar treatments with BCGC or BCGCR (10 μg/mL) for 2 h and T1-weighted MR (bottom) (TR/TE = 500/9.0 ms at 1.5 T) images of cell pellets after similar treatments with BCGC or BCGCR (10 μM Gd3+) for 24 h. (d) Statistics of total FL intensities (red) and average % MR signal enhancements (% SE, blue) of cell pellets in (c). (e) ICP-AES analysis of the average Gd uptake in each cell after indicated treatments in (c, bottom). (f) Fluorescence images of U87MG cells (untreated, incubated with 100 μg/mL BCGC or BCGCR, 6 h) followed by 10 μM DCFH-DA staining with or without laser irradiation (980 nm, 0.8 W/cm2) for 5 min (ex: 470 ± 20 nm, em: 525 ± 25 nm). (g) U87MG cell viability after incubation with different concentrations of BCGC or BCGCR for 24 h followed by exposure (or nonexposure) to laser irradiation (980 nm, 0.8 W/cm2) for 5 min. Values denote the mean ± SD (n = 5 for cell viability and n = 3 for others; **P < 0.01, ***P < 0.001).

