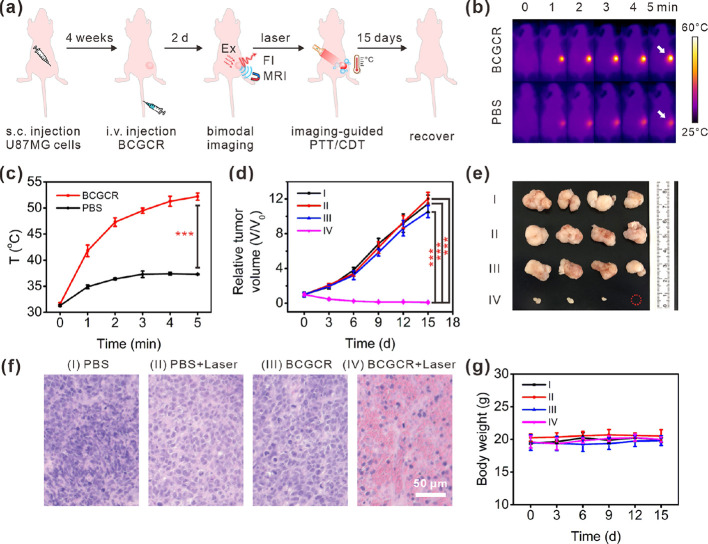
Figure 5.
Synergetic PTT and intensified CDT of tumors in vivo. (a) Schematic illustration of the process of fluorescence/MR bimodal imaging-guided synergetic PTT/CDT of U87MG tumors in living mice. (b) IR thermal images of U87MG tumors in living mice during exposure to 980 nm laser irradiation (0.8 W/cm2) for 0–5 min at 2 days after i.v. injection of PBS (200 μL) or BCGCR (5 mg/kg Cu2+, 200 μL). White arrows indicate the tumor locations in mice. (c) Average temperature variations of the tumor with time in (b). (d) Relative tumor volume variation in living mice with time after treatments with (I) PBS (200 μL), (II) PBS (200 μL) + laser (0.8 W/cm2, 10 min), (III) BCGCR (5 mg/kg Cu2+, 200 μL), and (IV) BCGCR (5 mg/kg Cu2+, 200 μL) + laser (0.8 W/cm2, 10 min). (e) Photograph of tumors resected from mice on the 15th day after the indicated treatments. (f) H&E staining of U87MG tumor slices resected from mice on the second day after indicated treatments. (g) Average body weight variation of mice with time after the indicated treatments. Values denote the mean ± SD (n = 4, ***P < 0.001).

