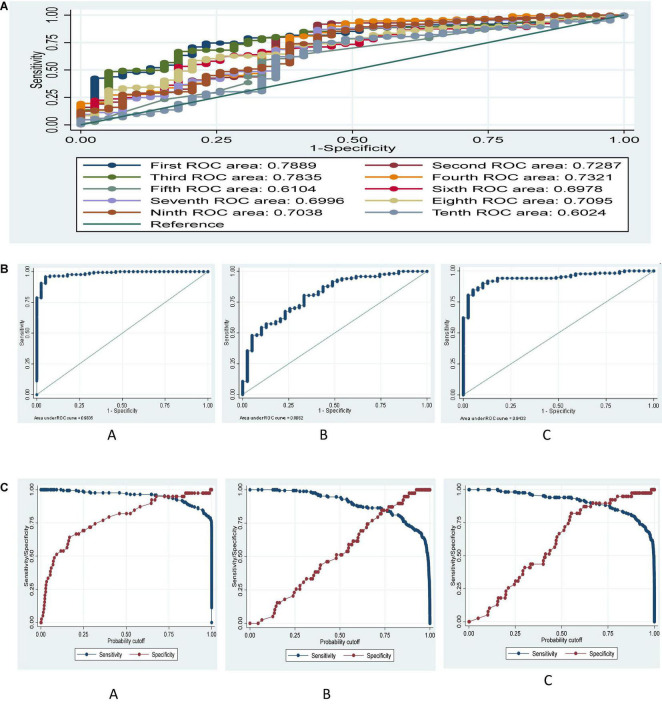
FIGURE 2.
(A) ROC curve for ten formulae based on derivation data set. Ho: area (First) = area (Second) = area (Third) = area (Fourth) = area (Fifth) = area (Sixth) = area (Seventh) = area (Eighth) = area (Ninth) = area (Tenth), chi2 (9) = 205.6, P < 0.001, (B) ROC curve for (A) ten (A), first five (B), and second five (C) new integrated weaning indices after multiple logistic regression based on the derivation data set. (C) ROC curve for sensitivity and specificity tradeoff for ten (A), first five (B), and 2nd five (C) new integrated weaning indices after multiple logistic regression based on derivation data set.

