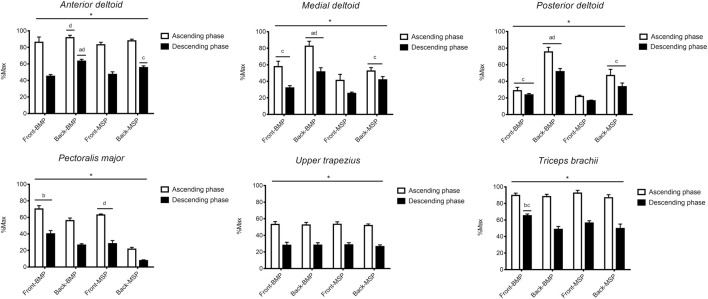
FIGURE 3.
Mean (SD) for the sEMG RMS of the muscles examined during the ascending and descending phase of each exercise. Besides the front vs. back and barbell vs. machine differences, sEMG RMS was greater during the ascending than descending phase in all exercises. a: p < 0.05 vs. front-BMP. b: p < 0.05 vs. back-BMP. c: p < 0.05 vs. front-MSP. d: p < 0.05 vs. back-MSP.

