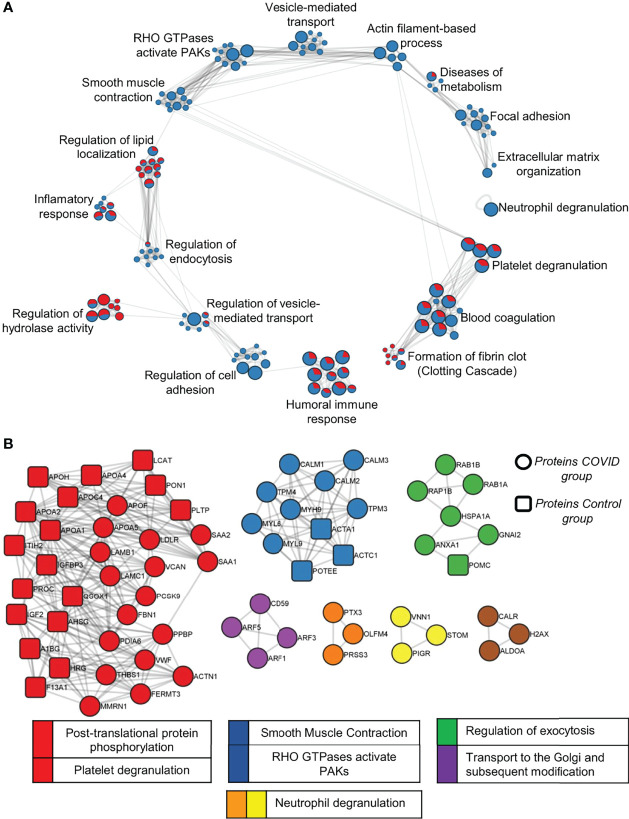
Figure 8.
Pathway analysis of C vs COVID-19 proteome. (A) A network of enriched pathway terms from protein lists of DEPs and EPs in the C vs COVID-19 comparison. Nodes that share the same ID are typically close to each other. Pathways database used was WikiPathways, GO Biological Process, KEGG, and Reactome. Red, C; Blue, COVID-12. (B) Protein–protein interaction analysis of DEPs and EPs was performed with STRING, BioGrid, OmniPath, and InWeb_IM databases. Only physical interactions in STRING (physical score >0.132) and BioGrid are used.

