
Figure 8:
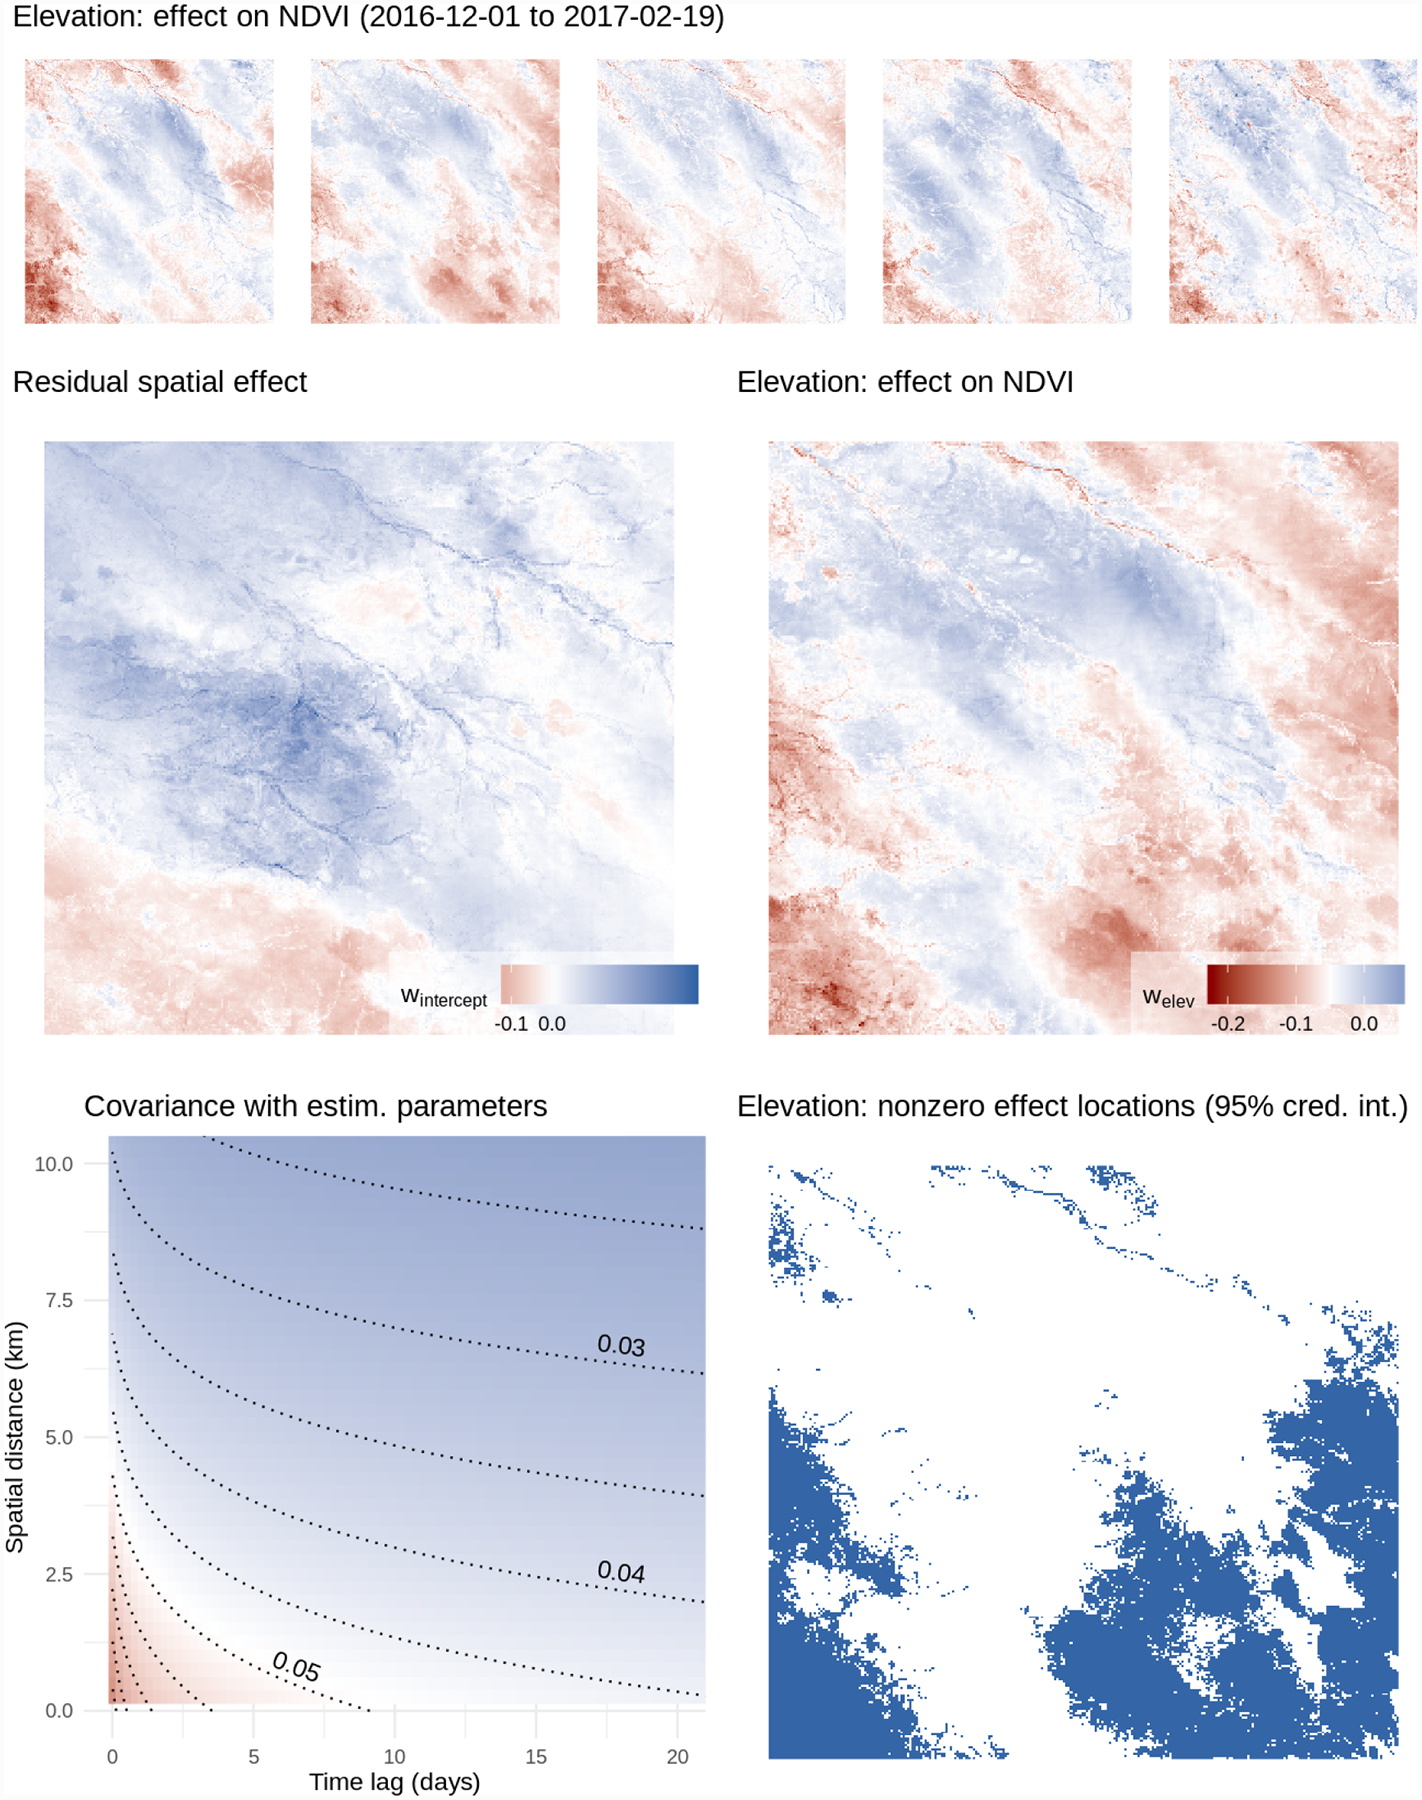
Top: the effect of elevation on NDVI output, evolving over five time periods. Middle left: effect on NDVI not explained by elevation; right: effect on NDVI attributable to elevation. Bottom left: estimated covariance at different space-time lags; right, in blue: locations with credibly nonzero effect of elevation on NDVI output.