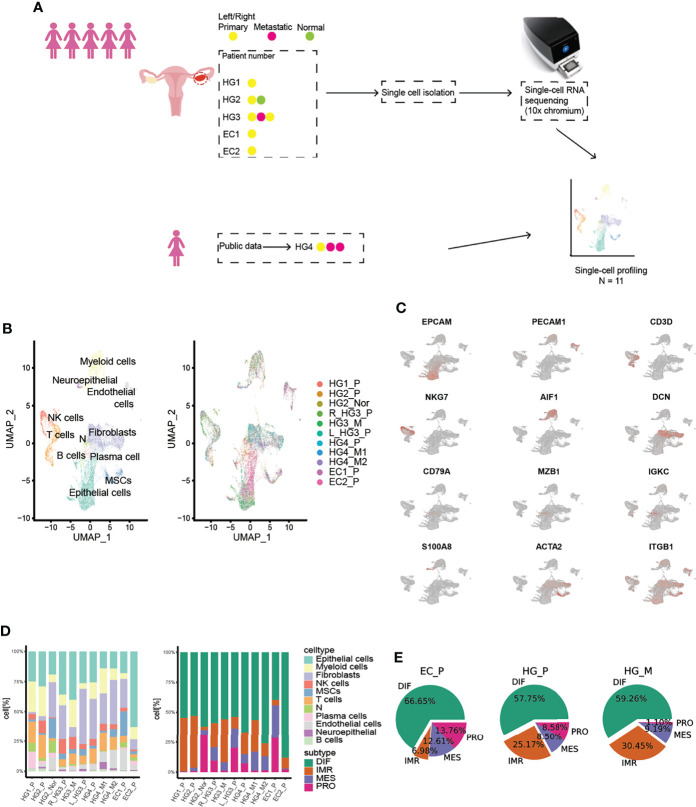
Figure 1.
Overview of TME in primary HGSOCs, metastatic HGSOCs, and ECs. (A) Workflow of the samples collected and the data analysis strategy. (B) Cell populations identified. The UMAP projection of 55802 single cells from HG_P (n=5), HG_M (N=3), EC_P (n=2), HG_Nor (n=1) samples shows the 10 main clusters with annotation. Each dot corresponds to a single cell, colored according to cell type. (C) Canonical cell markers are used to identify the clusters. (D) Barplots of the cell type and cancer subtypes for all 11 tumors. (E) The cancer subtypes proportion for each pathological group.

