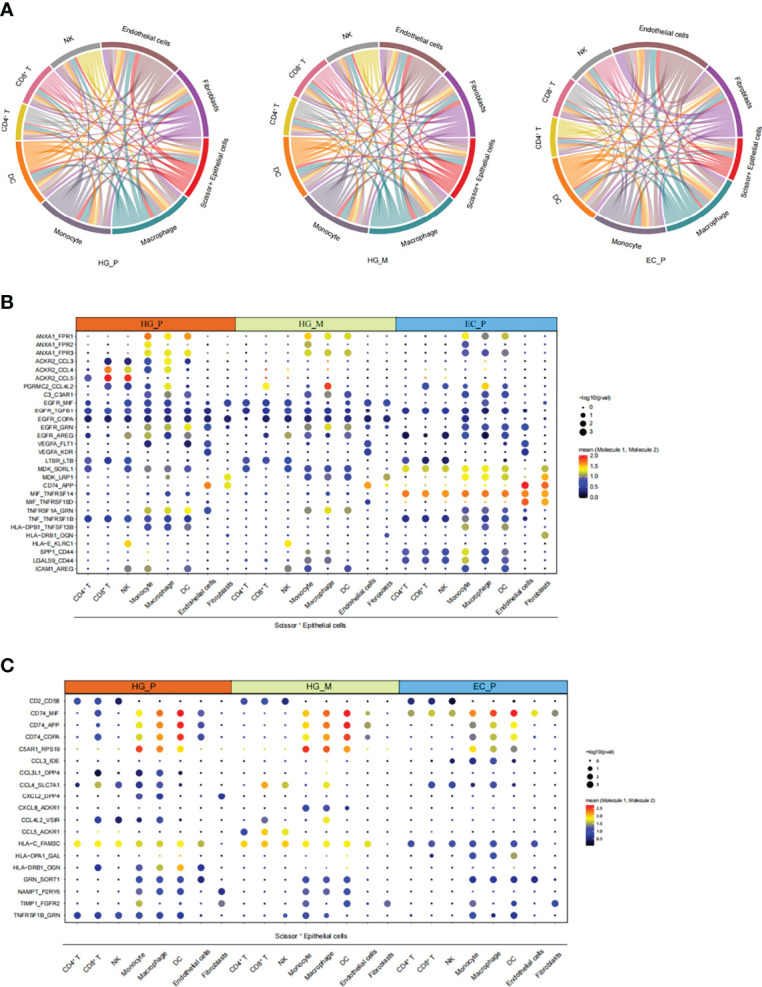
Figure 7.

The intricate intercellular interplay in HG_P, HG_M, and EC_P. (A) Circos plot shows the intercellular interactions in HG_P, HG_M, and EC_P. Each line represents an interaction where one end represents a ligand that is expressed in one cell type and the other end represents a receptor that is expressed in another cell type. The thickness of each line corresponds to the number of distinct interacting pairs. (B, C) Dot plot shows the means of the average expression levels and the possibility of occurrence in selective interaction pairs.
