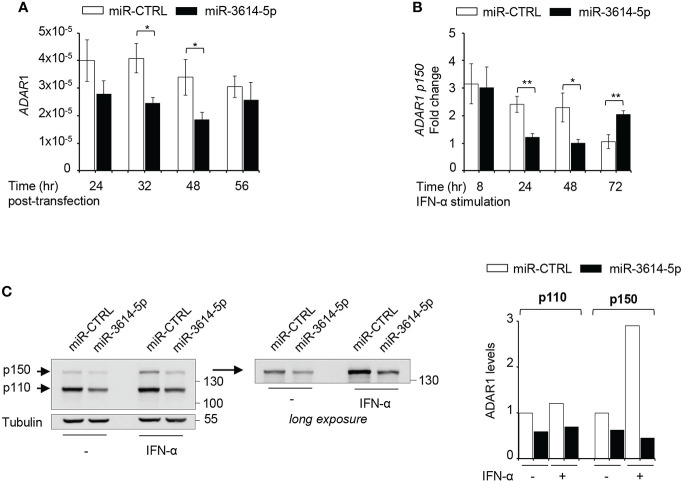
Figure 3.
A miR-3614-5p mimic targets both ADAR1 isoforms. (A) A miR-3614-5p or a miR-control (miR-CTRL) mimic was retrotransfected in HeLa cells. At the indicated times post-transfection the level of total ADAR1 mRNA was measured by qPCR. Results are shown as expression (2-ΔCt) relative to 18S used as housekeeping gene. Values are means ± SEM (n=3 separate experiments). *p<0.05. (B) HeLa were retrotransfected as in A) with miR-3614-5p or a miR-control (miR-CTRL) and 48 hr later, IFN-α (100pM) was added. Relative expression of p150 ADAR1 was measured at the indicated times after stimulation. The fold change represents the ratio of IFN-stimulated cells relative to unstimulated cells. Values are means ± SEM (n=3), *p<0.05, **p<0.01. (C) HeLa cells were retrotransfected as in A). Twenty-four hr later cells were stimulated with IFN-α (100pM) for 2 days and then processed for western blot analysis. Tubulin was used as loading control. Right panel, the membrane was covered below the 130 kDa marker and exposed for longer time to better visualize the p150 ADAR1 isoform. Protein bands were quantified and normalized to tubulin. For each isoform results are expressed as ratio of miR-3614-5p-transfected cells relative to miR-CTRL-transfected cells. The value in untreated miR-CTRL-transfected cells set to 1. The data are representative of three independent experiments.

