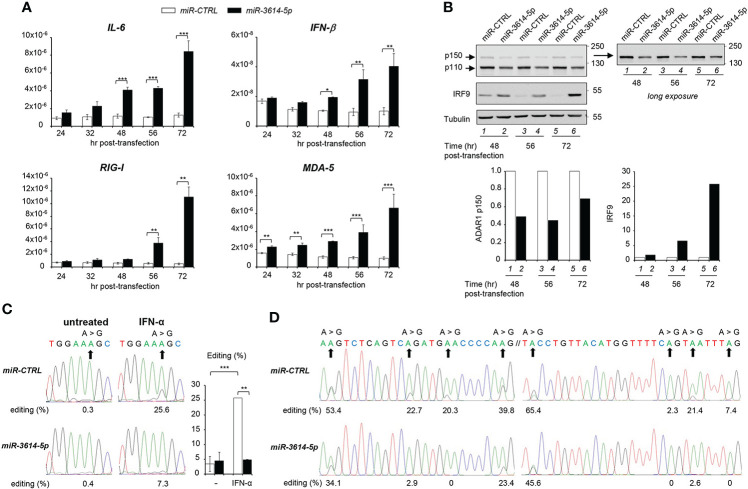
Figure 4.
MiR-3614-5p impacts innate cytokine expression and RNA editing. (A) HeLa cells were retrotransfected with the mir-3614-5p or the miR-control (miR-CTRL) as mimics. The relative expression of IL-6, IFN-β, RIG-I and MDA-5 was measured at different times after retrotransfection, as indicated. Values are means ± SEM (n=3 separate experiments); *p<0.05; **p<0.01; ***p<0.001. (B) Cells retrotransfected as in A) were lysed for western blot analysis at different times post-transfection. Lysates were immunoblotted as indicated. Tubulin was used as loading control. Right panel, the membrane was covered below the 130 kDa marker and exposed for longer time to better visualize the p150 ADAR1 isoform. Protein bands were quantified and normalized to tubulin. Results are expressed as ratios of miR-3614-5p-transfected cells (black) relative to miR-CTRL-transfected cells (white). Values in miR-CTRL-transfected cells were set to 1. These data are representative of two experiments. (C) HeLa cells were retrotransfected with the mir-3614-5p or the miR-control (miR-CTRL) as mimics. Two days later cells were left untreated or treated with IFN-α (100pM) for an additional 72 hr. RNA was extracted and editing was determined, as described in Materials and Methods. The percentage of editing was measured after sequencing the AZIN1 PCR products. Percentages of editing in AZIN1 transcripts are shown below the chromatograms of a representative experiment. Right histogram, three independent experiments were quantified. Values are means ± SEM; **p<0.01; ***p<0.001. (D) HeLa cells were retrotransfected with mir-3614-5p or miR-control (miR-CTRL) as mimics and left in culture for 56 hr. RNA was extracted and editing was determined, as described in Materials and Methods. The percentage of editing was measured after sequencing the EIF2AK2 PCR products. Two regions of an editing box located in 3’UTR of EIF2AK2 transcripts are represented. The two sequences have their genomic counterpart localized at chr2: 37,328,008-37,328,100 (24). Their percentages of editing are shown below the chromatograms. The data are representative of two independent experiments.

