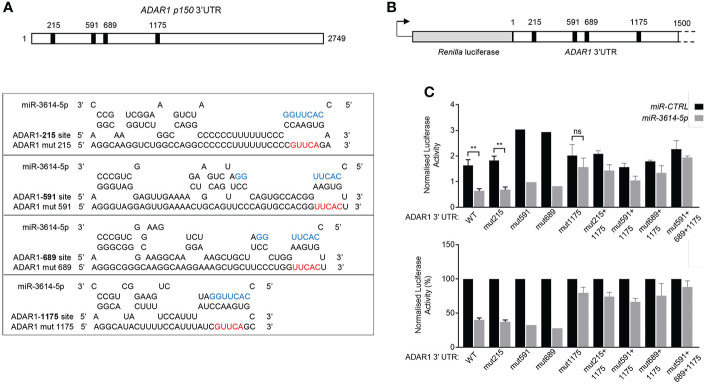
Figure 5.
MiR-3614-5p targets ADAR1 3’UTR through one major binding site. (A) Schematic diagram of the 3’UTR of the p150 ADAR1 transcript. Black boxes indicate the location of the four predicted binding sites of miR-3614-5p. Site 215 matches to miR-3614-5p positions 2-8 of the seed sequence with an A opposite to position 1. Site 1175 matches to miR-3614-5p positions 2-10. Site 591 and site 689 are two non-canonical 5-mer binding sites. The RNAhybrid miRNA target prediction tool was used (https://bibiserv.cebitec.uni-bielefeld.de/rnahybrid). Mutant ADAR1 target sites (mut215, mut591, mut689, mut1175) were generated by mutating 5nt complementary to the 5’ seed region of miR-3614-5p. The seed sequence is in blue. The mutated nucleotides are in red. (B) Schematic diagram of the 1.5 kb ADAR1 3’UTR sequence containing the four predicted miR-3614-5p binding sites (black squares) cloned downstream of Renilla luciferase in the psiCHECK-2 vector. (C) Luciferase assay to assess direct interaction of miR-3614-5p with the ADAR1 3’UTR. HeLa cells were retrotransfected with the miR-3614-5p mimic or the non-targeting control mimic (50nM) and the next day transfected with the dual luciferase reporter psiCHECK-2 carrying the ADAR1 3’UTR, as in (B). Twenty four hr later Renilla luciferase activity was measured and normalized to the internal firefly luciferase control (top panel). WT and mut1175 data: mean of four experiments each in triplicate. Mut215 data: mean of 3 experiments each in triplicate. Mut591, mut689 data: one experiment in triplicate. Data on combined mutations: mean of two experiments each in triplicate. Statistics is available only for results with 3 independent experiments. Data represented as mean ± SEM. *p<0.05, **p<0.01, ns = not significant. Normalised luciferase activities (top panel) are represented as percentage of the control mimic (bottom panel). Data are represented as mean ± SEM.

