Figure 8.
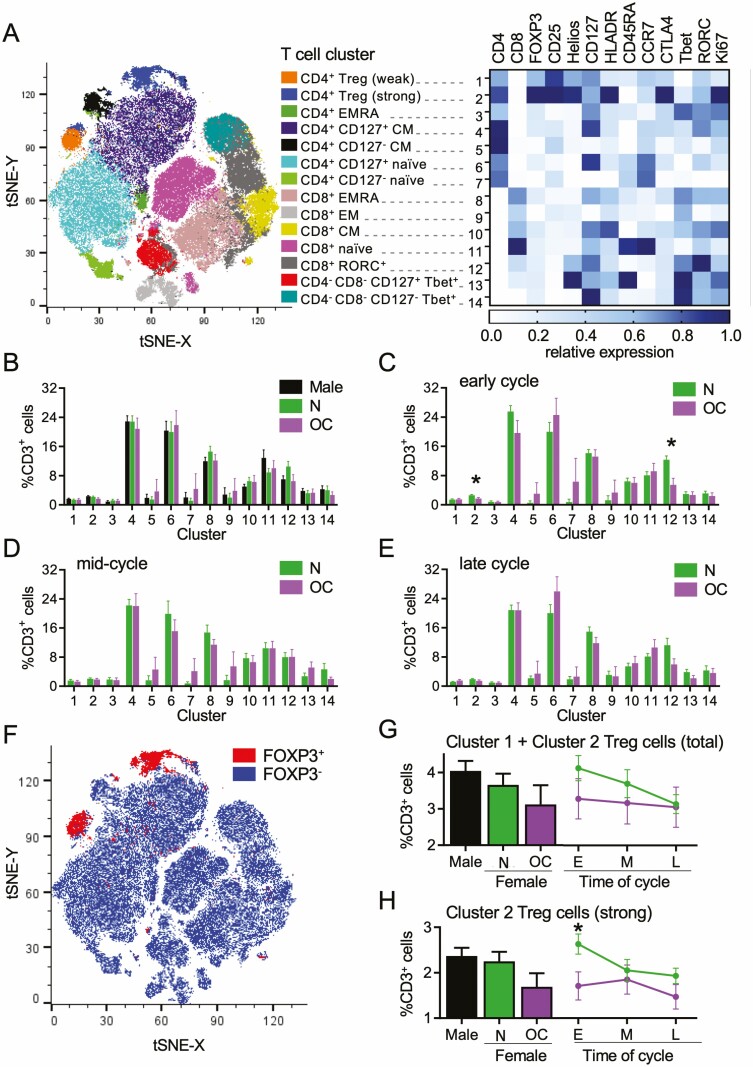
Dimensionality-reducing t-distributed stochastic neighbor embedding (tSNE)algorithm shows effects of oral contraception on peripheral blood CD3+ T cells. Peripheral blood drawn at early-, mid-, and late-cycle phases from naturally cycling women (N), women using oral contraception (OC), and men. Data for flow cytometry phenotyping of CD3+ T cells were concatenated into a single file and transformed by the tSNE algorithm. X-shift identified 14 unique cell clusters, and the relative expression intensity of each marker within each cluster was calculated using FlowJo software (A). The proportion that each cluster contributes to total CD3+ cells was calculated using linear mixed model analysis, and estimated marginal means were generated for men, N, and OC groups (B). The mean ± SE of the mean cluster proportions for N and OC groups are shown at the early- (C), mid- (D), and late-cycle (E) phases. FOXP3+ Treg cells within the concatenated file were manually gated to view their distribution (F). Two Treg cell populations were identified, Cluster 1 and Cluster 2, with phenotypes typical of “mild” and “strong” suppressive capability, respectively. Total Treg cells (Cluster 1 + Cluster 2) (G) and strong Treg cells (Cluster 2) (H) are shown as estimated marginal means for men and the N and OC groups (bar graphs) and line graphs of mean ± SE of the mean for N and OC groups in early- (E), mid- (M) and late-cycle (L) phases. The effects of participant group, OC use, and cycle phase on Treg cell clusters were assessed by 1-way analysis of variance and post hoc Tukey t-test (n = 8-17 participants/group; *P < 0.05).

