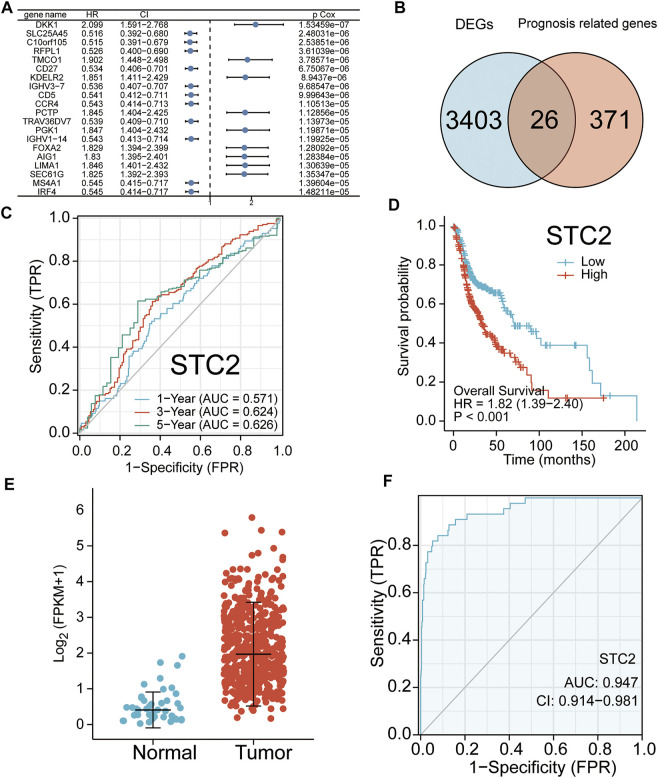
FIGURE 2.
Identified key genes and their examined prognostic significance. (A) Top 20 genes with the highest correlation to overall survival (OS) are shown. (B) Crossing the 3,429 DEGs with 397 prognosis genes. (C) Kaplan–Meier curve of STC2. (D) Time-dependent receiver operating characteristics (ROC) curves of STC2 for 1, 3, and 5 years (E) STC2 mRNA levels in HNSCC tissues (n = 502) and normal tissues (n = 44). (F) Diagnostic significance of STC2 in HNSCC. ROC curves were plotted and the area under the curve (AUC) of STC2 was 94.7%.

