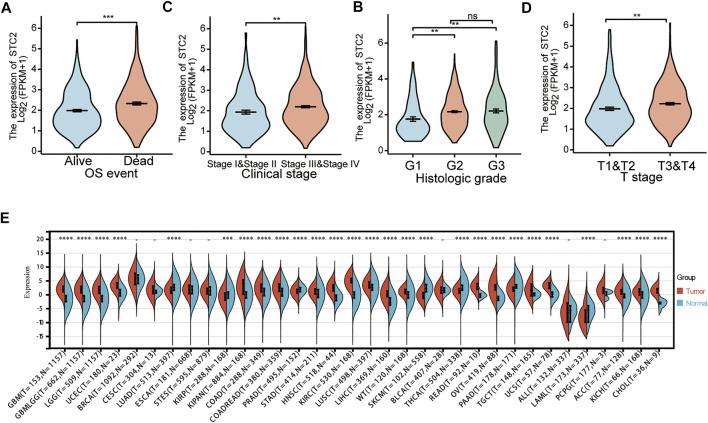
FIGURE 3.
Analysis of the correlation between STC2 expression and clinicopathology. (A) Expression levels of STC2 in different survival status of HNSCC. (B) Expression levels of STC2 in early and advanced cancer. (C) Expression levels of STC2 in different degrees of tumor differentiation. (D) Expression levels of STC2 in different tumor stages. (E) Expression levels of STC2 in 33 cancer types. *p < 0.05; **p < 0.01; ***p < 0.001; ****p < 0.0001.

