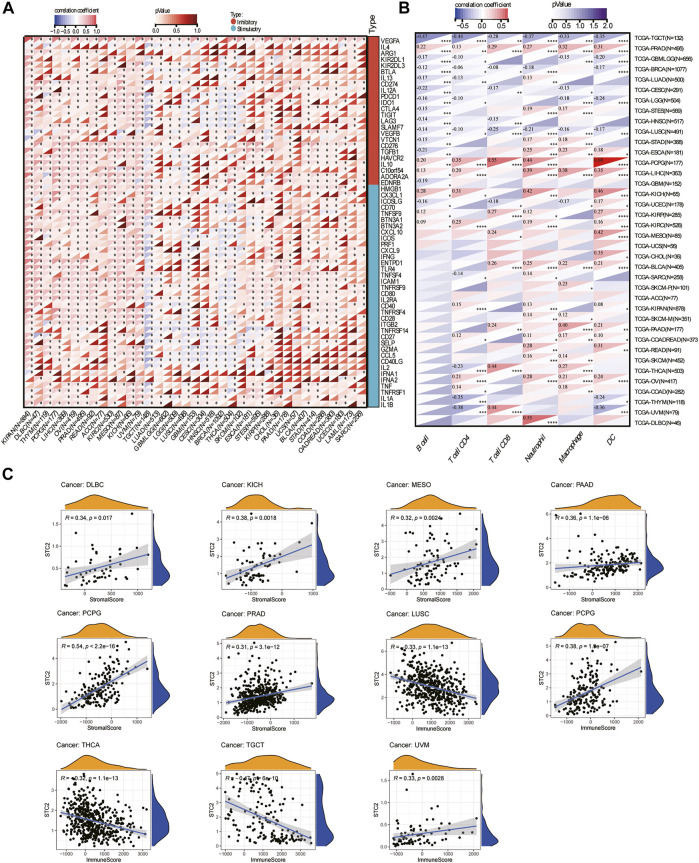
FIGURE 6.
Immunological correlation analysis. (A) The correlation between STC2 expression and immune checkpoint genes. (B) Correlation of STC2 expression with immune cell infiltration in 33 cancers. Blue represents negative correlation and red represents positive correlation. *p < 0.05; **p < 0.01; ***p < 0.001; ****p < 0.0001. (C) Correlation between STC2 and stromal scores and immune score.

