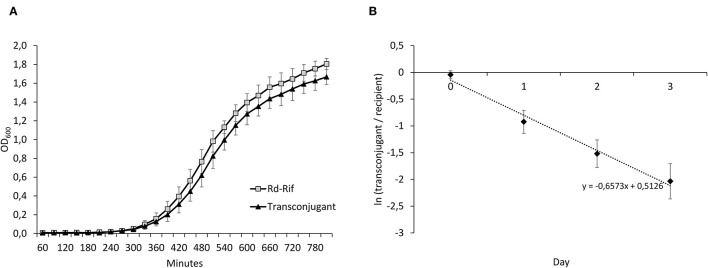
Figure 5.
(A) Growth curves of Rd-Rif and the transconjugant. (B) Results from head-to-head competition experiments between Rd-Rif and the transconjugant, displaying changes in ln(transconjugant/recipient) over time. The average regression (dashed line) is displayed. The negative slope value reflects a fitness cost of Tn7100. This was confirmed by calculations of relative fitness (w) of the transconjugant (w = 0.90, p = 0.002). Error bars indicate ± standard deviation.

