Figure 3.
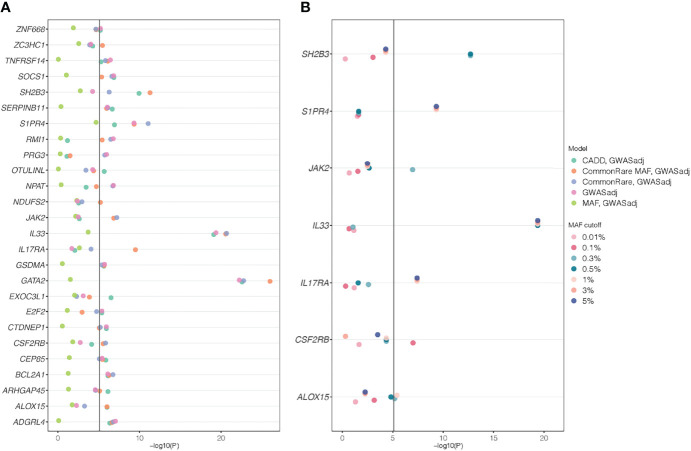
SKAT P-values from genes that are significant after adjusting for lead GWAS SNPs. Gene name is stated on the y-axes and −log(P-value) on the x-axes. The different colors depict the different models used in the analyses. (A) The five weighting schemes for the 26 genes that were significant after adjusting for lead GWAS SNPs. (B) The results when only analyzing rare variants, with different rare variant cutoffs (from 0.01% to 5%) and adjusting for lead GWAS SNPs. Among all 220 genes that were identified in the primary SKAT analyses, only seven genes that were significant for any of the rare variant cutoffs are shown; the others can be found in Supplementary Table S6. In all analyses, a P-value cutoff of 5.11 × 10−06 [−log10(P) = 5.29) was used, correcting for the 220 genes times 29 different models tested: seven rare variant cutoffs * two strata (full cohort and unrelated White British) and five weighting schemes for the GWAS-adjusted analyses * two strata and the five weighting schemes for the non-GWAS adjusted (primary/discovery) analyses in the full cohort.

