Figure 7.
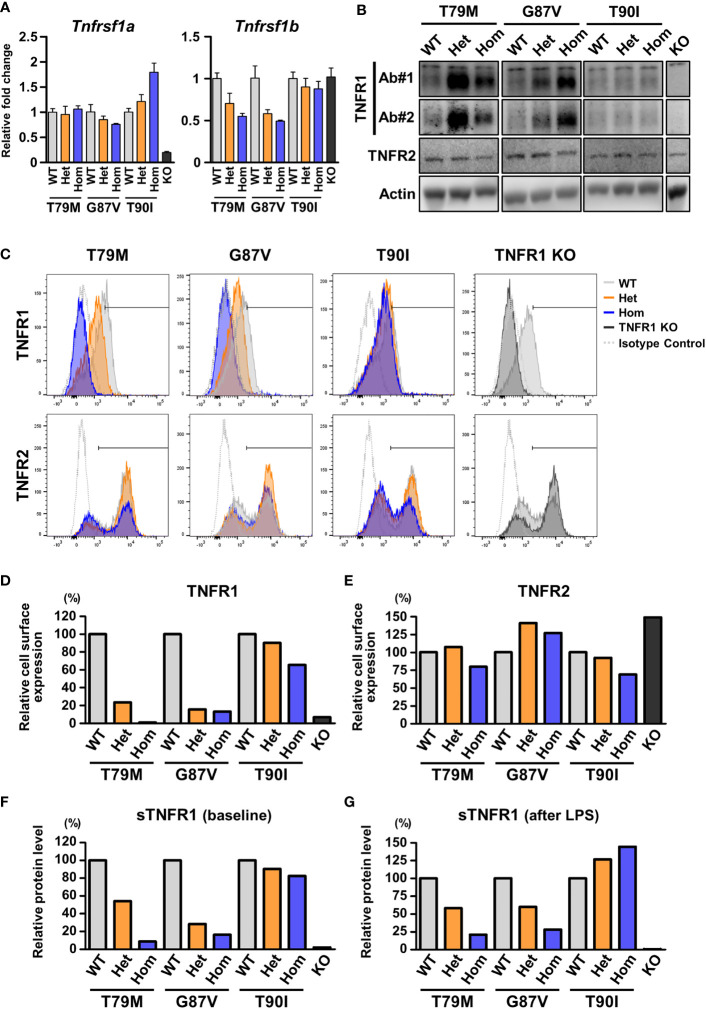
Decreased cell surface expression of TNFR1 in the TRAPS mutant cells. The expression of TNFR1 and TNFR2 were determined in primary murine bone marrow-derived macrophages and peritoneal macrophages. (A) mRNA expression levels of Tnfrsf1a and Tnfrsf1b in bone marrow-derived macrophages. (B) Immunoblot analysis of TNFR1 and TNFR2 expression in the bone marrow-derived macrophages. Two different antibodies against TNFR1 were used: Ab#1 (13377, Cell Signaling Technology) recognizes aa 29–43 (extracellular domain), and Ab#2 (AF-425-PB, R&D Systems) recognizes the C-terminal intracellular region. (C–E) Flow cytometric analysis of TNFR1 and TNFR2 expression. Peritoneal exudate cells were collected from the indicated mice 3 days after the intraperitoneal administration of thioglycolate. (C) Representative histograms of the cell surface expression of TNFR1 and TNFR2. The expression levels of TNFR1 (D) and TNFR2 (E) on the surface of CD11b-positive cells were determined by flow cytometry. The cells within the horizontal line on each histogram were recognized as TNFR1- or TNFR2-positive cells. The proportions of the positive cells were calculated relative to those of the WT in each strain. The following antibodies were used: TNFR1 (113005, BioLegend) and TNFR2 (113405, BioLegend). Both antibodies recognize the extracellular domains. (F, G) ELISA for soluble TNFR1 (sTNFR1) in the culture supernatant of bone marrow-derived macrophages. Culture supernatant was collected before (F) and 24 h after (G) LPS stimulation. Concentrations of sTNFR1 in the culture supernatant were measured by ELISA, and the levels were calculated relative to that of the WT in each strain. TRAPS, TNF receptor-associated periodic syndrome; LPS, lipopolysaccharide; ELISA, enzyme-linked immunosorbent assay; WT, wild-type; Het, heterozygote; Hom, homozygote.

