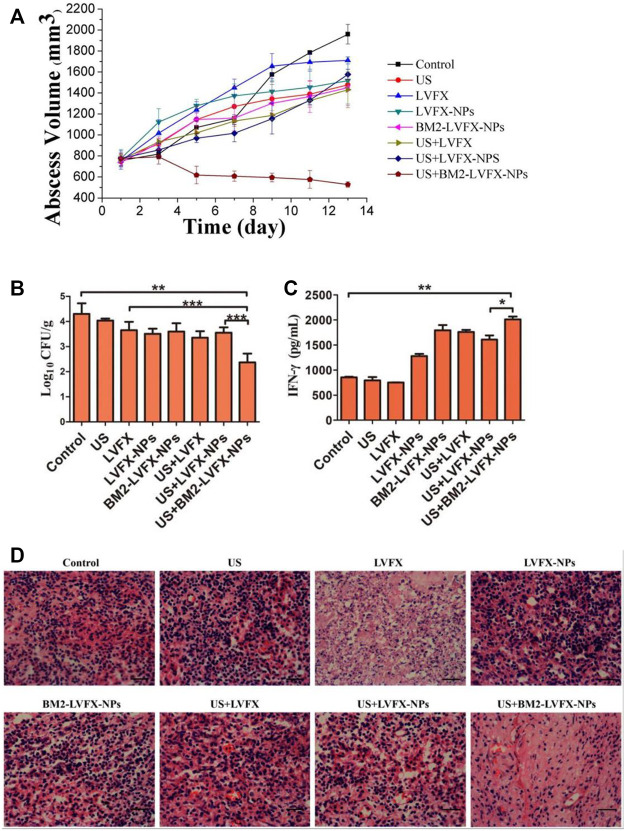
FIGURE 12.
In vivo SACT efficacy of BM2-LVFX-NPs combined with ultrasound. (A) The time-dependent abscess volume curves of infected rats in each group. (B) Colony counting analysis (Log10 CFU) of bacterial cultures from the abscess tissue in the rats after a 14-day treatment. **p < 0.01, ***p < 0.001. (C) Serum IFN-γ level of BCG-infected rats on Day 14 after treatment. (D) Histopathologic observation of the infected tissues of every group after being treated in various ways. The scale bar is 50 μm. Reproduced with permission from Li et al. (2021). Copyright © 2021 the authors.

