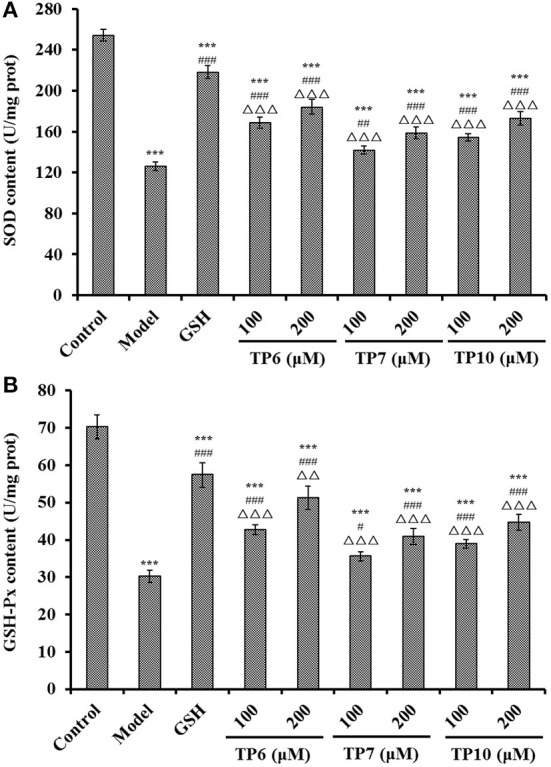
Figure 11.

Effects of TP6, TP7, and TP10 on the SOD (A) and GSH-Px (B) levels of H2O2-damaged HUVECs. All values are means ± SD (n = 3). ***P < 0.001 and **P < 0.01 vs. control; #P < 0.05, ##P < 0.01, and ###P < 0.001 vs. model; ΔΔP < 0.01 and ΔΔΔP < 0.001 vs. GSH.
